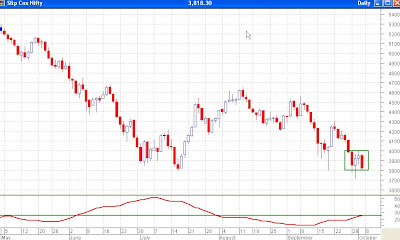
There is nothing much to say today. I had a look at a lot of charts today. I saw the 30 minutes chart of the Nifty, the 60 minutes chart of the Nifty, the daily charts, the weekly charts, the monthly charts, had a look at the charts of various stocks too,and yet after having seen all those, I am still at a loss for words. I honestly do not know what is going to happen tomorrow or in the coming days. All I know is that from the charts of the stocks that I had a look at, things aren't looking too rosy. That obviously does not mean that things are looking bad. I can't say whether things are bad or not but they are definitely not good.
 As far as the Nifty goes, I have attached the daily chart of Nifty on top. There is not too much to discuss on this too except for the last four days. As marked by the green rectangle, the prices have been moving within a small range between 3800-4000. Four days is too short a time on the daily charts to term it as a range bound movement, yet the rules/fundamentals of rectangles or trend channels do apply here. i.e. the top of the range at 4000 should provide resistance whereas 3800 should provide support. In case 3800 is broken, there is some minor support available at previous lows at 3777 and 3715 but a major support is not seen till 3635. While an intraday movement of below 3800 can be expected, a close below 3800 will be bearish. The ADX indicator, which measures the speed of a trend has also reached 24 after attaining a low of 11 which indicates that the speed of the downfall/downtrend is picking up. It pays to be cautius.
Please do subscribe to my posts, so that all posts are delivered free to your inbox and you don't miss any useful analysis of the markets in the future.
Happy Investing!!!
No comments:
Post a Comment