Thursday, July 31, 2008

Nifty Displays 'Three Black Crows' Candlestick Pattern

There was good news from the American and Asian markets this morning. The Dow was up 266 points and all Asian markets were between a percent to two percent in the green. Because of these reasons, the Nifty opened with a positive bias and continued to take prices up throughout the day. With so much of cheer the world over, our markets happened to be cheerful too and the Nifty ended the day 123 points in the green while the Sensex closed 495 points above yesterday. There was good news from Europe as well. The closing was good two. Both the London FTSE and the French CAC closed almost two percent up while the German DAX ended with a gain of a percent. The news from around the world may not be all that good tomorrow. The American markets opened in the green today and while the Dow Jones has lost all its gains by now, the Nasdaq is already in the red. The crude front is also not looking all that healthy today with the crude already trading above $127 a barrel.

Nifty Daily Chart - Three Black Crows Candlestick Pattern

Attached above is the daily chart of Nifty. The Nifty, as can be clearly seen, has reversed after testing the top of the trend channel. This was expected since the 4180-4200 support is quite a strong support. Yesterday we did see the Nifty go down to a level of 4160 intraday but it closed at 4190. If we have another day of upmove tomorrow and if the prices were to go above 4350, we would have a pivot low in place at 4160. A pivot low formed at 4160 would mean that the Nifty has finally formed a pattern of higher highs and higher lows, which would bring the Nifty back in an uptrend. Back in an uptrend means, we should be buyers now and our stop loss for all long positions should be the most recent pivot low at 4160. But before we go on to buy, we should be aware of the different definitions of an uptrend. Technically, a stock (or an index) comes back in an uptrend when it goes up, comes back down to form a low (which is higher than the previous low) and then goes back up above its previous high. Quite often the prices first go on to make a higher high (like the Nifty displayed this time around) and then form a higher low. Here there are two schools of thought. One says that the uptrend has started, whereas the other school waits for the prices to go back above its previous high (in which case it makes it two higher highs and a higher low) before buying. Needless to say, the second school of thought has a much better chance of making a profit. And it is also understood that it is the first school which buys at a cheaper price and makes more profits if the signal turns out to be correct for them.

I would normally side with the first school rather than the second but it all depends on the situation. At present, if the Nifty were to go above 4350 tomorrow, there is resistance close by near 4480 (this level will keep reducing every passing day) as suggested by the trendline. What if the Nifty were to reverse from this level? I’ll be making a profit of only 100 odd points, which is not much. Also, there is likelihood that the candlestick pattern formed here is that of ‘three black crows’, which gives a very negative outlook to the Nifty. Had the small narrow range blue candle, formed on Monday, not been there, this would have been a classic ‘three black crows’ pattern, which happens to be a reversal pattern. It is the presence of this blue candle that creates doubts. The ‘three black crows’ candlestick pattern usually follows a period of strong advance and within this pattern three black(in our case, red) candles/shaded candles are formed with non-existent or small lower shadows. These three candles have lower highs and lower lows. Usually, the fourth candle is a white/blue/unshaded candle but could also be a black/red candle. The fifth or the sixth candle, generally, takes the prices below the low of the ‘third crow’. If this does turn out to be a ‘three black crows’ pattern (ignoring the blue candle formed inbetween the crows) and the low of 4160 is broken in the next one or two days, we could be looking at a retest/breakthrough of the 3800 lows too. For now, I would much rather stay with the second school of thought and buy only if the Nifty were to go above its previous high of 4540.

Please do
subscribe to my posts, so that all posts are delivered free to your inbox and you don't miss any useful analysis of the markets in the future.

Happy Investing!!!

Wednesday, July 30, 2008

Nifty Breaks Down, Support Between 4160-4180

The Nifty opened flat today with a slight positive bias. But soon after 11AM the RBI Credit Policy was announced in which repo rates were increased by 50 basis points to 9% while the CRR was increased by 25 basis points to 9% with an effort to reduce inflation. Though, a rate hike was already discounted into the prices, a 50 basis points hike was not expected. Most participants, with inflation figures stabilizing near 11.8-12%, were expecting a 25 basis points hike. Hence, when the news of the hike came, the markets tanked and then just couldn’t recover throughout the day. Finally, the Sensex ended the day with a loss of 557 points while the Nifty was 142 points in the red.

Nifty 30 Minutes Chart - Support at Top of Trend Channel

After yesterday’s dull day, it was clear that the Nifty didn’t have the steam to go up despite its going above the resistance line. Attached above is the 30 minutes chart of the Nifty. We can see clearly that the Nifty today broke through the support marked by the upward sloping trendline numbered 1. As expected, there was additional support near the top of the trend channel between 3800 and 4180. While the Nifty did go below the 4180 support, it finally closed the day at 4190. Now the first support available is between today’s low near 4160 and the top of the trend channel, 4180. If the Nifty does manage to go below 4160, the next support comes in at the trendline marked 2 near 4100. There are other supports too below that near 3900 and 3800 but for tomorrow, I don’t think we need to look beyond the 4100 support.

News from the international front is better too. While the European markets closed flat, the Dow Jones is up almost 200 points. There is good news from crude oil too. It did lose about $5 today but at the moment it is trading with a loss of $3 for the day at $122 per barrel. If the Asian markets too remain good tomorrow morning, we should see the Nifty bounce back from the top of the trend channel. Going by the Fibonacci retracements too, the Nifty has already retraced 50% of the rise in the last week. Now, whether the Nifty sees this 50% retracement as a good retracement or whether it finds the 61.8% retracement a more reliable support is yet to be seen. 61.8% retracement comes in at 4077.

Please do
subscribe to my posts, so that all posts are delivered free to your inbox and you don't miss any useful analysis of the markets in the future.

Happy Investing!!!
Monday, July 28, 2008

Lackluster Day for the Nifty

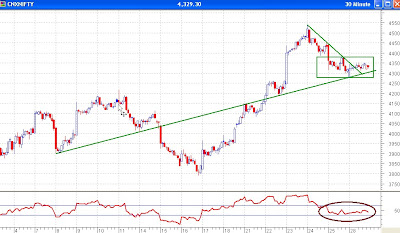
The Nifty opened flat today with a slight positive bias. All through the day, it maintained a very narrow range of about 40 points. It did move up and down about 2-3 times during the day but all through this range of 40-45 points was maintained. A slight dip in the first fifteen minutes found support near the trendline discussed yesterday (and today). The Nifty, as predicted that it might, reversed from that trendline. But then all through the day it remained lackluster, which is worrying.

Nifty 30 Minutes Chart, Nifty Takes Rest

Attached above is the 30 minutes chart of the Nifty. Just like yesterday’s chart this also comes attached with the same two trendlines and the 14 period Relative Strength Index (RSI). There are some negatives and some positives to this chart. Let us look at the positives first. First of all, support was found at the lower trendline and it moved up from there. Secondly, the upper trendline was broken through, which again is a positive for the National Stock Exchange (NSE) Index. Thirdly, the RSI is finding support at 40 repeatedly as marked by the brown circle.

But, as I said there are some negatives too. Firstly, the trading throughout the day was dull and boring and even after the breakout above the trendline, there was no enthusiasm which suggests that things may not be all that good for Nifty. Secondly, international cues are not too good. European markets closed more than a percent in the red. Dow Jones, at the time of going into print, is trading about 200 points down while crude is attempting a recovery, though it is not very successful at the moment.

All we can say for tomorrow is that the Nifty seems to have slipped into another trading range, though, a much narrower one, between 4280 and 4380. A move above 4380 should be bullish while a move below 4280 should be bearish in the short term. Long term and intermediate term investors should wait for the pullback to complete before taking the plunge.

Please do
subscribe to my posts, so that all posts are delivered free to your inbox and you don't miss any useful analysis of the markets in the future.

Happy Investing!!!

Sunday, July 27, 2008

Serial Blasts in Bangalore and Ahmedabad

After five days of excellent gains, the Nifty did cool down a little with two days in the red too. After a loss of 43 points on Thursday, it went on to lose 121 points on Friday. Nifty was trading within a narrow range of 30-40 points till about 1 PM. After that for the next hour or so it staged a good recovery and crossed the highs of the day. But at 2PM came the news that Bangalore was rocked with 7 bomb blasts in a space of 75 minutes which left 1 dead and eight injured. Thankfully, they were all low intensity blasts and were blasted more to create panic than to cause destruction. That news sent the market crashing down and the Nifty finally closed with a loss of 121 points at 4312.

Nifty 30 Minutes Chart - Bullish RSI, Support at Trendline

Attached above is the 30 minutes chart of the Nifty with the Relative Strength Index (RSI) at the bottom. Also, on the chart, are an upward sloping trendline and a trend channel between 3800 and 4200. As seen from the chart, the upward sloping trendline is providing support to the prices at 4285. In case this support does not hold, the prices may come further down to the trend channel near 4180-4190. One reason why the prices should find support near the trendline is the RSI. The RSI, as can be seen within the thick brown circle, is finding support near 40. And the RSI finding support near 40 is bullish for the markets, at least in the short term. Three examples of the RSI finding support near 40 have been marked with the green circles and green arrows on this chart itself.

However, things look pretty bad. After 7 blasts in Bangalore on Friday, Ahmedabad was rocked with
16 bomb blasts in a span of 70 minutes leaving 45 dead and 145 injured. Apart from this there was a live bomb found in Bangalore, one in Ahmedabad’s Amraiwadi area and two cars with explosives were found in Surat. The blasts were claimed by a militant outfit calling itself Indian Mujahideen and they even threatened Mukesh Ambani with ‘horrifying memories which you will never forget’. This surely, could bring the markets down. And in case 4285 support is broken, that will then become a resistance. Even if support is found at 4285, there is resistance nearby at the downward sloping trendline near 4340.

Please do
subscribe to my posts, so that all posts are delivered free to your inbox and you don't miss any useful analysis of the markets in the future.

Happy Investing!!!

Crude Oil: Where Will It Stop?

Another weekend. Another day of confusion for me to think of what to write about. That is because markets are closed on weekends and I do not do analysis of Friday’s markets till Sunday night. So, Friday/Saturday posts I have to write about general interest to me and all my readers. Of course, I could write about cricket but that is my interest and I’m not too sure whether it is also the interest of my readers and subscribers too. And, moreover, there is nothing to write about cricket on a day when India lost to Sri Lanka by an innings and 239 runs within four days. Hats off to Muttiah Muralitharan who ended with 11 wickets in the match! No wonder he has the highest number of wickets in Test matches. And I do believe him when he says that he will end up with 1000 Test wickets in his career. Anyways, since cricket is not on my blogging list, let us shift to the next most important thing – crude.

In an earlier post, I had written that there were signs visible that crude was showing signs of topping out. And in fact, that day turned out to be very close to the final high made in crude. We all know that crude finally broke down a few days later and is now more than $20 off its highs. People are talking of support near $120, some say $110 and some even say $80. I do not have access to charts of crude traded on NYMEX (New York Mercantile Exchange). Hence, I do the analysis based on the charts formed by prices on MCX (Multi Commodity Exchange). Since MCX is an Indian exchange prices are quoted in Rupees.

Crude Oil MCX Daily Chart - Fibonacci Retracements

Seen above is the daily chart of crude since the beginning of 2008 along with a trendline, a couple of Fibonacci Retracement analysis and the Relative Strength Index (RSI). Let us start with things in chronological order. My previous post on crude talked about the presence of various dojis (a day on which the opening price and the closing price is the same or is very close to each other), which made the charts look a little bearish, even though the prices were increasing every day. Also seen on the charts is a bearish divergence between the prices and the RSI where the prices are increasing while the RSI is falling (as marked by the thick trendlines and the brown arrows). Next, let us come to the trendline. The prices finally broke through the trendline three days after that analysis but soon recovered. The trendline was decisively broken about a week later when the crude prices even went below the most recent pivot low. Not only that, yesterday it has decisively broken through the pivot low formed in end of May. What remains to be seen is whether this can be qualified as an intermediate term downtrend or not. Technically, the breakthrough the most recent pivot low and an uptrend line gives quite a bright possibility that the trend may have reversed. However, it is not confirmed till we have a pattern of lower highs and lower lows visible. While lower lows are seen on the chart, a lower high has not been formed as yet. So, we would have to wait for a pullback and see whether the previous highs are broken through or a lower high will be made. Another post on my blog, which did the Elliott Waves Analysis of crude may suggest that an intermediate term high may have already been made.

Let us now see where support is likely. For this purpose I have used Fibonacci retracements. I have used two retracements starting from the lows marked at A and B till the high marked at C. As seen from the chart and the price action in the last two days, support is being found near the 38.2% Fibonacci retracement level of AC and near the 50% retracement level of BC. One possibility is that the prices may find support at these levels and may reverse, which could happen to be a short term (or who knows, a long term) reversal. If the prices do break through these levels, support may be found near 4865 where two Fibonacci retracements of 50% (of AC) and 61.8% (of BC) converge. Support may even be found there. Of course, it may decide to continue going further down. Where it eventually finds support can only be decided by the crude itself and no amount of analysis can say with certainty where the ultimate support would be found.

Please do
subscribe to my posts, so that all posts are delivered free to your inbox and you don't miss any useful analysis of the markets in the future.

Happy Investing!!!

Thursday, July 24, 2008

Pullback Starts, Nifty Closes 43 Points in the Red

The Nifty was just waiting for a negative trigger to fall. The Nifty opened about 60 points in the green and then throughout the day kept falling. What was the negative trigger early in the morning? Probably none. It did try to recover at about 11AM but did not succeed. Later in the afternoon European markets also opened weak and then our markets could not recover though it staged a recovery of about 30-40 points before closing. In spite of that recovery the Nifty closed 43 points in the red while the Sensex closed with a loss of 165 points.

Nifty Daily Chart - Resistance At Trendline

Attached above is the daily chart of Nifty with two downward sloping trendlines, a rectangle between 3800 and 4200 and the RSI. The Nifty found resistance exactly at the second trendline (the one on top) as marked on the chart. That was where the resistance was expected. The Relative Strength Index (RSI) as marked in the brown circle shows that the RSI turned from a level of 60. This is not bullish for the markets. It also shows that we may not be completely out of the woods. According to me, the levels of the RSI give a very good indication about the markets. I feel markets are bullish when RSI goes above 60 and bearish below 40 and sideways between 40 and 60.

Okay, a pullback is coming. Where is this pullback going to stop? When do I buy? Frankly, we do not know where the pullback will end. The markets shall decide that. We shall follow the markets and will position ourselves to buy when the pullback is over. We can try and analyse where the support levels are. The first support is near 4310, the second one is the top of the rectangle, i.e. 4200, the third at 4000 and finally at 3800. We don’t know where it will find support but we shall buy when the market rises for two days in a row but only if the low of the pullback is above the previous low of 3800. Keep reading this space everyday and we shall know when the pullback is over and what is the most opportune time to buy.

Please do
subscribe to my posts, so that all posts are delivered free to your inbox and you don't miss any useful analysis of the markets in the future.

Happy Investing!!!

Wednesday, July 23, 2008

Stocks Rally: Am I Missing The Bus?

Stocks in the Indian markets rallied for a fifth day in a row today. And this rally today was to be expected after our government won the trust vote in the parliament yesterday. This was to be expected because the Government's win would mean that the nuclear deal will go through (if the NSG and the AIEA do not object). This was good news for the markets because of which the Nifty opened above 4400 and finally ended the day at a high with a gain of 236 points.

I was out today and have just come back home and it is late at night so I won't go into the analysis of charts today. But before I finish, I would like to add one more thing here. A lot of my readers would be thinking that if the stocks continue to rally like this and this does turn out to be a bull market then, surely, they will miss the bus if they do not 'jump in' now. Well, as mentioned yesterday, I would say that this does not seem to be a bull market because the symptoms are not such. But the market can prove us wrong too. It surely can, but even if this is the beginning of a new bull market, this will also have to go through the customary corrections. And it will give us a lot of opportunity to enter. Today's close means that the market has risen 17.3% in just a matter of five days. And that is a big rise in a bear market and a correction has to come in sooner or later. It is just that we are not getting any negative news to trigger a correction. American markets are flat today, European markets closed with gains between a percent and a half to two percent and the Asian markets were also well in the green earlier this morning. Crude continues its downward journey and is now trading at $124.50.

My point is that new bull markets take time to build up whereas it is generally the bear market rallies which are sharp and give us a sense of hope. My point is that a market which has risen 17% in five days would be quick to fall at the first sign of a negative news. A correction of Fibonacci 61.8% can safely be assumed and if we assume today's high to be the high of this rally then that means a pullback to 4060 is possible. Even if it does not fall to that level, I would be more comfortable buying after the pullback is over than now (even if I have to buy a few points higher than what it is today).

Those who think they will 'miss the bus' need not worry because the markets would definitely see a pullback. One must exercise caution when 'jumping in moving buses' because it can lead to accidents and injury. It is wise to 'jump in' when the 'bus slows down' and I am waiting for just that time.

Please do
subscribe to my posts, so that all posts are delivered free to your inbox and you don't miss any useful analysis of the markets in the future.

Happy Investing!!!
Tuesday, July 22, 2008

Government Wins Vote, Loses Credibility

The Government today won the trust vote. Big deal! They managed to win the trust vote by 19 votes. 275 votes were cast in favor of the government, 256 against and 10 abstentions. While stability in the government was retained, our 'honorable' Members of Parliament made a mockery of themselves and the voting process on live television. Talks of MPs being ‘bought’ were now made public with three MPs claiming to have been bribed to abstain from the vote. The charges, whether true or not, have made us realize what all actually happens in politics (as if we didn't already know). The government, for sure, has won the vote, but lost its credibility, in the eyes of the ‘aam aadmi’ (common man).

The Nifty went up today too making it four consecutive days of ‘decent gains’ in a bear market. The Nifty opened flat in the morning but after news of Omar Abdullah’s National Conference (having 2 MPs) decision to support the UPA government came, the market started going up, solely because the support of those two MPs would have seen the government through the trust vote successfully. Since then the markets have been up only (except a small pullback to 4200) and managed to close on a high too. 80 points above yesterday’s close and 40 points above the top of the range which was at 4200.

Nifty Tick by Tick Chart - Head and Shoulders Pattern

Seen above is the tick by tick chart of the Nifty for today from 12:30pm onwards, which was taken from the NSE website. Clearly seen is a bullish head and shoulders pattern formed in the Nifty which has been marked on the chart. The pattern has already been confirmed and gives us a target of 4300 on the Nifty which happens to be 60 points away. Hopefully, that target should easily be achieved on opening tomorrow.

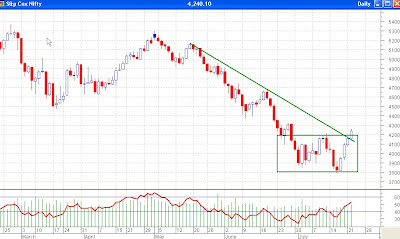
Nifty Daily Chart - Bear Market Rally or New Bull Market?

Attached above is the daily chart of Nifty which shows the kind of rally we have seen in the last four days. It has now risen more than 11% in the last four days, has crossed the downward sloping trendline on the daily charts, has moved out of the range and now has managed to close above its most recent pivot high of 4215. Is this a bear market rally or the beginning of a new bull market? Well, it certainly looks like a new bull market but I wouldn’t advise my readers to be too sure about it. My reasons are that new bull markets are born on pessimism and the new bull market rallies would never be as sharp as the one we have just seen. Secondly, a very common phrase in the stock markets is to buy on rumours and sell on news. We have seen the market moving up on hope that the government would win the trust vote. Now that is public knowledge and the smart investor may now be looking to book his profits rather than building a position. Thirdly, a true confirmation of a bull market is when the market is making higher highs and higher lows. As yet, we have just seen a higher high but not a higher low. A correct strategy would be to wait for a pullback and then a rally for two days to see where the new pivot low is formed. If the low formed is above the previous low of 3790 then it may mean that a bull market has started but if the pullback goes lower than 3790 then there may be more pain left.

Please do
subscribe to my posts, so that all posts are delivered free to your inbox and you don't miss any useful analysis of the markets in the future.

Happy Investing!!!

Monday, July 21, 2008

No Major Move Till Trust Vote

After two days of gains, we saw another good day today. Politics has become very interesting and Parliament has become a comedy circus with our honourable MPs going back on their words and changing loyalties by the minute. The numbers game and the ‘horse-trading’ continues as the countdown to the trust vote draws closer. At 4pm on Tuesday the members will cast their votes and it will become clear whether the UPA government will fall or will stay. This will become another nail biting finish going down to the wire.

As of now, the UPA has 269 MPs supporting it, 268 against it and 3 are still undecided. If the Opposition gets the support of at least two of these and the UPA gets one then it is going to be a tie and the speaker would have to vote. The speaker, Somnath Chatterjee, being from the Left, it goes without saying where his loyalties stand but to be fair to him, nobody knows who he will vote for in case of a tie, not even the Left. The closest finish so far was when the Vajpayee government lost the no confidence motion in 1999 by a single vote when Jayalalitha led AIADMK withdrew support from the 13 month old government. However, Vajpayee came back to win the elections and even lasted the full term as the leader of a coalition government.

Nifty Daily Chart, Range Bound Movement

Attached above is the daily chart of the Nifty. As suggested in yesterday’s post, 4165 was supposed to act as the resistance and today’s high turned out to be 4168 before closing at 4159. It is still not possible to determine whether this resistance would be broken or not. If the prices go above 4165 tomorrow, they could go to the top of the range at 4200. A breakthrough above 4200 will also mean that the next target for the Nifty would be 4600. I personally feel that tomorrow is going to be a dull day for the markets in terms of price change. But I do not rule out a volatile session (without any major change in the closing price). I do not expect the Nifty to go above 4200 before the vote is cast. But there may be a lot of participants who would like to close their long positions before close tomorrow, and some may even be willing to go short, to cash in on the opportunity if the government were to lose the trust vote tomorrow. This may take the markets down. The next two days are going to be news driven days and for technical traders it is the best time to go on a holiday since technical analysis does not work on news driven days.

There are no international cues to talk about right now. The European markets were nothing to write home about while the American markets, at the time of posting, were trading flat. Crude was about $2 dearer but that was only to be expected after such a sharp fall was seen in the last two days.

Please do
subscribe to my posts, so that all posts are delivered free to your inbox and you don't miss any useful analysis of the markets in the future.

Happy Investing!!!

Sunday, July 20, 2008

Nifty Range Widens - 3800 to 4200

Another fantastic day for the Nifty (and for us) on Friday. The opening wasn’t great and it opened flat and remained so for the next three hours or so, before making a run for the tops. The run lasted throughout the rest of the day and in the end managed to close 145 points above Thursday’s close, which itself was 131 points above Wednesday’s, thus gaining 276 points in two days. Before these two days the Nifty had broken out of a range between 3850 and 4200 to go to a low of 3790 and to close at 3816.

Before these two days of gains, we could have said that the 350 points rangebound movement between 3850 and 4200 had been broken towards the downside and that the new target for the Nifty was 3500. Unfortunately Fortunately, that did not happen and we saw these two terrific days which makes us say that the range has only become broader now, broadly between 3800 and 4200 and a breakthrough on any side should give us a 400 points movement.

Nifty Daily - Range Bound Movement, Bullish Divergence

Seen above is the daily chart of Nifty loaded with the Relative Strength Index (RSI) and a trendline connecting the highs made in mid May and mid June and extended till now. This downward sloping trendline shows that there is resistance for the index near 4165, which will be difficult to cross. In case this resistance is crossed then we have another resistance which is the top of the trading range at 4200. A breakthrough through the 4165 reistance line will indicate that a breakthrough of the trading range may also take place. In case it reverses from 4165 then the inverse is also true that 3800 on the downside may also be broken. A clear uptrend will emerge when the top of the trading range at 4200 is broken through and if the Nifty manages to cross its previous pivot high at 4215.50. Indications of this trading range being broken through on the upside are bright since this is the first time on daily charts that a positive/bullish divergence between the RSI and the prices is seen, as seen from the brown trendlines and green arrows. A positive/bullish divergence occurs when the prices make lower lows while the RSI, or any other oscillator indicator, make higher lows. But a divergence cannot be taken as a confirmation of a reversal in trend. It only gives an indication that a change in trend may take place, whether it happens or not is for the market to decide. After all, there have been events in the past when the weather becomes all cloudy and dark and yet it does not rain.

Whether a low has been made in the short term or there may be more downside is difficult to say at the moment. It all depends on how the government, the opposition, the crude and the rest of the world behaves in the time to come. Any risk to the government will be taken negatively, crude continuing to fall will be taken positively while global sentiment will affect the Indian markets too in the same manner. What actually happens can be decided by the combination of all these factors and there is no point predicting the outcome of all of these situations. In times like these, just follow one simple maxim – “A trend is a friend and should be followed till the end.” And as of now (till the Nifty crosses 4215), the trend remains down.

Please do
subscribe to my posts, so that all posts are delivered free to your inbox and you don't miss any useful analysis of the markets in the future.

Happy Investing!!!

Thursday, July 17, 2008

Nifty May Fall to 3500, Started Looking Attractive

The Nifty opened today and started going up but like most of the days these days, the excitement lasted only about an hour or so before it started slipping down again. It made a low at about 3840 and started some recovery but soon after the European markets opened it started coming down again. The European markets were weak and at one point the FTSE was about a hundred points down but recovery in the late afternoon session (in Europe – by which time India had already closed) took all European markets well in the green (about a percent up) except FTSE which closed 21 points in the red. News on the international front is good today. Dow is trading 200 points up at the moment while the crude is trading below $135 a barrel. The American markets increased after results from Wells Fargo, a huge mortgage underwriter and servicer, which according to Bloomberg, came out with “better than expected” results after their profits declined by 23% and EPS was 53 cents a share against expectations of a 50 cents EPS. This was enough to make Wells Fargo jump 24% in a day. Compare this with Infosys results and the price movements, and we know how negative the sentiment in India is.

Nifty Monthly - Stochastics at All Time Low, RSI near historical supports

Seen above is the monthly chart of Nifty for the last decade. The indicators along with the price chart are the Stochastics oscillator (in green) and the Relative Strength Index (RSI) at the bottom. Never before in the history of the Nifty was the Stochastics down to these levels. Today was the all time low of the Stochastics indicator (5,3,3) in the last 16 years. As far as the RSI is concerned, it is only on one occasion in the last 16 years that it has went down below 40 (in September 2001) otherwise it has always found support at 40. Today the RSI was 44.43 and hopefully, this time too it may reverse from 40 (we assume such a long trend to continue until it is broken). The price chart shows a little more downside because the long term trendline drawn from the 2003 lows shows that there is support near 3500, which is in line with the target that we had calculated in yesterday’s post. Both the RSI and Stochastics show that the bottom may not be very far away.

Fundamentally too, the things are not looking too bad. According to the NSE website, the Nifty today closed with a Price to Earnings Ratio (P/E) of 16.33. At the same rate, assuming the price does fall to 3500, the P/E of the Nifty too would fall to 14.97 at current year earnings. Going forward, assuming that the earnings would grow at only 7% (the same as the GDP growth) per annum, the Nifty would then be available at only 13.99 times FY09E and 13.08 times FY10E. Today, it is available at 15.26 times FY09E and 14.26 times FY10E. Even during the Sep 2001 lows (after the Twin Towers crash) the Nifty was trading at a P/E of between 12 and 13 times earnings. Considering that the economic conditions may be better 6 to 12 months down the line, don’t these P/E levels of 15 to 16 times seem attractive? To me, they do.

Please do
subscribe to my posts, so that all posts are delivered free to your inbox and you don't miss any useful analysis of the markets in the future.

Happy Investing!!!

Tuesday, July 15, 2008

Nifty Breaks Down, Target of 3500?

The Nifty opened very weak because of weak American and weak Asian markets. Except for the first hour, within which it remained rangebound, never during the day did it show any signs of recovery. During the day there was news that Fitch Ratings has revised India’s local currency outlook to negative. Along with that it has also revised FY09 GDP growth to 7.7% and are looking at a fiscal deficit of around 6.5% of GDP. While this news was displayed and flashed on websites after the markets, the market must have known about it much before it was made public.

Nifty 30 Minutes Chart - Break Down from Range

Looking at the 30 minutes chart of the Nifty, we see that a large range between 3850 and 4200 was broken today with the Nifty closing below 3850 in the last 30 minutes. With the Nifty breaking below this 350 points range, we have a downside target of another 350 points, which from 3850 translates into 3500 levels.

There are various targets for the Nifty now. A lot of people are talking about support at 3600. We ourselves have got a target of 3500, as mentioned above.
One of my previous posts mentioned of a target of 3671.70 or even 3048.75 and yet another post talks about a possible target of 2600. Now, what levels the Nifty attains is for it to decide. We know that all these are just theoretical targets and the markets may or may not achieve them. We also know that when it reverses into an uptrend, it will warn us by making higher bottoms and higher tops and we should then take long positions. As of now, we are out of the markets and sitting on cash waiting for the most opportune time to invest.

Please do
subscribe to my posts, so that all posts are delivered free to your inbox and you don't miss any useful analysis of the markets in the future.

Happy Investing!!!

Monday, July 14, 2008

4000 Stop Loss for Open Long Positions in Nifty

Today was one day when the Nifty kept going up throughout the day, except for a sell-off that was encountered in the last hour and a half. At one point the Nifty went high enough to cross the figure of 50 points in the green but after the sell-off, in the last 30 minutes went as low as 40 points in the negative but then managed to close only 9 points below yesterday.

Nifty 30 Minutes Chart - Trend Channel

The Nifty, as seen from this 30 minutes chart shows that the index has been moving within this trend channel since the beginning of the month. It is constantly finding resistance near the top end of the channel and support near the bottom end. As seen from the trend channel, support comes in close to 4000 levels while the resistance level lies between 4230 and 4250. A move outside this trend channel should give us a reasonable big move. The two dojis seen at the end of the day and the Relative Strength Index (RSI) within the black circle, which shows that it is finding it difficult to go below 40, suggests that this downmove maybe over for the time being. But like always, every positive is accompanied by a negative, and in this case it is the fact that the last rally that was seen today, failed to reach the top end of the line. Now, which side of the channel will the prices break is for the market to decide. We shall just follow the trend as and when that happens. As of now, we keep the stop loss for short term long positions below 4000.

The fact that every positive is accompanied with a negative is what makes the markets so fascinating and thrilling. This is why the uncertainty comes in and why one person wins while the other loses money. If there is no uncertainty in the markets, the thrill will be lost. And this is why the markets, time and again, continues to remind us that our analysis is no good and is thoroughly wrong. This is why it is improper to predict the markets and wise to follow the trend. This is why we analyse the markets just to get an idea of what may happen and be prepared with a strategy if that does happen. And whether or not, that will happen is totally the market’s prerogative.

Please do
subscribe to my posts, so that all posts are delivered free to your inbox and you don't miss any useful analysis of the markets in the future.

Happy Investing!!!

Sunday, July 13, 2008

Earlier Nifty Lows to be Tested Soon

Friday was a bad day for the markets. Markets opened flat and slightly upbeat owing to the excellent results posted by Infosys. Good results were expected to offer a positive kick to the markets. Though, the mood was upbeat, yet there was cautiousness in the markets as the market was waiting for the future guidance. Sure enough, the Infosys management increased the guidance for the next quarter and for the whole year. But what it also did was that it did not increase the guidance in dollar terms. That started a brief sell off. But soon the inflation numbers came in too with inflation increasing to 11.89%. I wonder what caused the markets to go up after these numbers came in. But whatever it was, it didn’t last long because the IIP (Index of Industrial Production) numbers came too and that showed a growth of only 3.8% as compared to over 10% last year. I think that was what caused the massive sell-off which took the Nifty 200 points below its high but closed 113 points below Thursday’s close.

Nifty Daily Chart - Rising Wedge??

Looking at the daily chart of the Nifty attached above, one can see that the Nifty was rising in a small channel since the last two days. It was clear that we would come in an intermediate term uptrend if, and only if, the Nifty were to cross 4300 levels. That failed to happen, which means that this was just a bear rally which fizzled out and which could take us to levels much lower than the earlier lows of 3850. However, there is a fairly strong support available between 3850 and 3900 which should stop the Nifty from falling below these levels. A move below 4000 will be fairly conclusive proof that earlier lows may be tested, if not broken. But the Relative Strength Index (RSI) shows that it has not gone below 40 in spite of this sharp fall yesterday. If this support at 40 holds, we may recover from the current levels. But, seeing the momentum of the fall on Friday, that seems to be only a remote possibility.

Please do
subscribe to my posts, so that all posts are delivered free to your inbox and you don't miss any useful analysis of the markets in the future.

Happy Investing!!!

Thursday, July 10, 2008

Crashed Hard Disk

Hi Guys! I am sorry but my machine's hard disk crashed. I have got it reinstalled and reformatted but all the problems that come with the crash are there. I have yet to get my charting software reinstalled and get all the data back. So, today I will not be in a position to do any analysis. Hopefully, I should be up and running by the weekend and will bring you my analysis of the markets on Sunday evening/night.

Please do subscribe to my posts, so that all posts are delivered free to your inbox and you don't miss any useful analysis of the markets in the future.

Happy Investing!!!

Nifty Target of 4300 Visible in Short Term

The Nifty opened with a huge positive bias because of all the positives visible in the Indian political situation and the global markets, as were mentioned in yesterday’s post. The Nifty jumped up about 130 points in the first five minutes of trade and about 160 points up in the first fifteen minutes. Things then cooled down a bit and the Nifty came back within the range discussed in yesterday’s post. It was only in the mid-afternoon when the European markets also opened positive that the Nifty broke through the trading range and went on to make new highs for the day.

Nifty 30 Minutes Chart - Triple Bottom

Above is the 30 minutes chart of the Nifty and shows that a triple bottom has been made over the period of the last 10 days. This is the first time in the 8 months history of this blog that the Nifty has made a triple bottom. The blog has seen lots of double bottoms and double tops but never a triple bottom. A triple bottom is a reversal pattern, as are the head and shoulders, double tops and bottoms and triple tops. A reversal pattern means those patterns that are generally found towards the end of trends. This triple top being confirmed may well show that the downtrend of the Nifty has now finished, at least in the short term. We are now in a well defined short term uptrend, the target for which is at least 4300. It may find resistance near the trendline marked by the arrow which lies between 4310 and 4320. A move above that trendline may turn out to be good for the markets.

What is the future of the markets? Have the markets made a temporary bottom or a major bottom? Is there any more pain left in the markets? Here is
a video which gives both sides of the story. You pick which side you want to believe. I, personally, agree with Surjit Bhalla of O(x)us Invt and fully agree with him that markets do tend to bottom out 6 months before the economy does. And I’m pretty sure that the fundamental situation and economies of the world will be showing a much better picture than what has been painted today.

So, what do we do? I feel there is no point trying to predict whether the markets will go down or go up. We should just follow the trend. We buy now in the short term because the short term trend is now up. We should buy with a medium term time frame when the intermediate term changes to up. No attempt should be made to predict the markets because that brings a bias in our trading decisions. We let the markets decide what it wants to do because markets have a mind of their own, a brain of their own.

On a lighter note, like all of us, the market’s brain is divided into two sides – a left side and a right side. Unfortunately, the left side has nothing right in it while the right side has nothing left in it.

Please do
subscribe to my posts, so that all posts are delivered free to your inbox and you don't miss any useful analysis of the markets in the future.

Happy Investing!!!

Tuesday, July 8, 2008

Left Withdraws Support, Markets Rangebound

With the Nikkie down 225 points down and the Hang Seng down roughly 350 points when our markets opened, our market was bound to open with a downward gap. The Nifty lost about 100 points in the first five minutes itself. The Nifty hovered around those levels for the next couple of hours and then started inching its way up. It had recovered only about 80 points from its lows when the news came out that the Left front had withdrawn support from the government over the nuclear deal issue. That caused the Nifty to come down again but the news was taken rather bravely by the market and by closing the Nifty had lost only 40 odd points.

Nifty 60 Minutes Chart - Rangebound Markets

It is clear now that the Nifty will remain inside a narrow range for sometime. Attached above is the 60 minutes chart of the Nifty which shows that it has now been moving within a narrow range between 4100 and 3850. One can also see that the last two troughs saw a low being made near 3900 which acts as another minor support. Confirming that the Nifty is going to stay within the range is the Relative Strength Index (RSI), which has been consistently finding resistance near 60 and support near 40 as indicated by the green arrows. A stock or, for that matter, an index can remain inside a range for hours, days and even weeks. We don’t know how long this range is going to be but since it is a very narrow range, it should be broken soon. A move outside the range should give a movement of about 200 points, depending on which side it breaks out on. While no positions are advised till the Nifty remains within this range, yet buying a 4100 call and a 3900 put (July expiry) should be a good strategy at the moment. With the Nifty at 4000 today, both should be fairly cheap. At closing, the 4100 call was available for Rs.80/- while the 3900 put was available for Rs.150/-. It amounts to an investment of Rs.230/- for unit of Nifty or Rs.11500/- per lot of Nifty. On breakout, the losing position should be closed while the other should be carried on. Since the target after breakout is only 200 points and the investment is Rs.230/- one should not expect a lot of profit from this but this is fairly safe. And if the breakout comes soon, one may gain more than expected because the time value would still be there in the option prices.

Let us talk some politics now. The Left withdrew support and yet the market went up. Why? Well, mainly because the government has already got the support of the Samajwadi Party and while it still falls a few votes short of the magic number, it may be able to get the support of a few independents and small parties before the vote of confidence. There are a lot of positives from the developments today. Firstly, the government has announced that they will go to the IAEA with the nuclear deal. If the deal goes through it will be a big positive for the markets. The Left withdrawing support may actually turn out to be good for the government. With the Left providing support, the government had not been able to introduce any reforms in the last four years. With the hurdle now out of the way, the government may actually be able to do something good for the country, provided the Samajwadi Party does not act funny. An early election would mean elections in November while according to the normal schedule elections are to be held in April-May 2009. So, a six months early election won’t be very materialistic for the markets. In fact, an early election may be good for the markets because it only reduces the time of uncertainty (except that then it could jeopardize the nuclear deal). The Prime Minister, Dr. Manmohan Singh, who is now in Japan attending the G8 summit has sent signals home that the Chinese may not oppose the nuclear deal and if the government continues the deal may go through. The US has already committed that it will help lobby India’s case with the Nuclear Suppliers Group (NSG). So, there are a lot of positives today. A lot of small investors understand the Left withdrawal to be a negative but it is more of a positive than a negative.

At the time of writing this post, the European markets are between 1 and 2% down while the Dow is about 50 points in the green. But a big positive is that the crude is slipping. It is already down to $136 a barrel and with such a sharp fall it seems the uptrend may now have ended. A proper analysis of crude would be done in tomorrow’s post.

Please do
subscribe to my posts, so that all posts are delivered free to your inbox and you don't miss any useful analysis of the markets in the future.

Happy Investing!!!

Monday, July 7, 2008

Small Range Between 3940 and 4110

The Nifty opened with a big bang today and soon reached near its earlier pivot high of 4105. The Nifty made four attempts during the day to cross that barrier but it proved to be a very tough resistance. Finally, in the late afternoon trade, after news came in that there was a suicide bomb attack on the Indian embassy in Kabul, the market started falling. It fell pretty sharply for whatever time was left in the session and let the Nifty close with gains of only 14 points during the day.

Nifty 30 minutes Chart - ADX Indicator

Seen above is the 30 minutes chart of the Nifty which shows that the Nifty went through the resistance line with a bang today on opening bell itself but that is where the problems started for Nifty. It reached its previous resistance which happened to be the pivot high formed last week. After trying to go past the resistance for most of the day, the Nifty failed to do so and fell sharply in the afternoon. As shown by the green lines, the Nifty is now in a range between 3940 and 4110. The ADX indicator which is still below 20 will remain at low levels till the Nifty remains within this range. A breakout from this range – either up or down should take the ADX to levels past 30. What is to be noted is that the ADX indicator on the daily charts is still at 51. For the Nifty to change its direction, the ADX should first slow down to levels between 20 and 25 before going up again. A prolonged stay within the range for a few days should do that for the Nifty. For now expect a short term uptrend above 4110 and a short term downtrend below 3940/3850.

I had to go out somewhere and came back late. Since it is now very late in the night, I won’t go into too deep an analysis and just rest my pen here tonight.

Please do
subscribe to my posts, so that all posts are delivered free to your inbox and you don't miss any useful analysis of the markets in the future.

Happy Investing!!!

Sunday, July 6, 2008

This Rally May Fizzle Out

The Nifty had a good day on Friday too. With a fabulous 200 point increase in Nifty on Wednesday and all its gains being washed away on Thursday, Friday turned out to be a good balm for the wounds of Nifty. A 90 point increase in the Nifty came at a good time but the move up was gradual and interrupted by regular corrections during the day. Inflation was a major worry and with inflation moving up to 11.63%, the market started coming down but not for long. The next move up took it past the earlier highs of the day but then it went into a 40 point range between 3980 and 4020.

Nifty 30 minutes Chart - ADX and RSI, Fizzling Uptrend

Seen above is the 30 minutes chart of the Nifty along with the Directional Movement ADX indicator on top (green colour with red horizontal lines) and the Relative Strength Index (RSI) at the bottom (red colour with blue horizontal lines). The ADX indicator, as mentioned in yesterday’s post, measures the strength of a trend while the RSI measures the strength of a stock/index with respect to its historical prices. As seen from the chart, and as marked by the green arrows, every successive low in the Nifty saw a reduction in the strength of the trend, as measured by the ADX. Now the ADX is at a level of 15 and below 20 it does indicate that there is no trend in the market except sideways. This gives us an indication that the downtrend may have been over.

So, are we in an uptrend now? Not yet. As mentioned in
a previous post, a short term uptrend shall be confirmed only if the Nifty were to go above 4105. We would get an early indication that the trend has changed if the Nifty were to go above the downward sloping trendline. The RSI finding support near 40, as marked by the green circle, also gave us positive indications about a forthcoming uptrend. Unfortunately, things change fast where the markets are concerned. With a 90 points increase in the markets, anybody would say that a short term uptrend will come about. However, the charts suggest differently. The move, as already mentioned, was slow and lacked momentum and, though the prices managed to cross the trendline, there was no excitement/large range candle associated with the breakout, which gives me doubts whether the breakout was genuine or not. The RSI finding resistance near 60, as marked by the brown circle, and failing to go above it also makes one wonder whether an uptrend will come now or after another brief correction.

At this moment, I’m afraid, this increase in prices may fizzle out once again. We may see another fallback to the lower trendline to 3920 or upto the previous lows below 3850 (or even lower??) before we make another attempt at a pullback. A move below 3875 will signify that we are back in a downtrend.

Please do
subscribe to my posts, so that all posts are delivered free to your inbox and you don't miss any useful analysis of the markets in the future.

Happy Investing!!!

Saturday, July 5, 2008

The World Around Us

Today is a weekend and on weekends I, usually, write about general things for which I don’t get time during the week. On previous occasions, I have written about mutual funds, the US Recession, Retirement Planning, Greed and Fear, Renewable Energy, Price to Earnings Ratios, Rules for Analysing Charts, why technical analysis works, Fibonacci Techniques and have done a couple of webinars also. The whole week a question keeps propping up in my mind that what am I going to write about this weekend and sometimes my mind draws a blank and I don’t know what to write about. Today happens to be one such weekend. Maybe you readers can give me some ideas about what I should write about. Just send me a list of topics about which you need some more information and I can keep picking up a topic from the list and every weekend I can write about a different topic. I hope to get a list which could last me 2-3 months. So please send in your lists today.

Though, I didn’t know what I should write about, but then I thought why not write about something which seems to be driving our markets. And in my opinion, there are three things that are driving the Indian markets, namely, inflation, crude prices and the American markets. Inflation, I feel, is more because of the shooting commodity prices the world over rather than being an Indian phenomenon. The government is trying to control inflation by regulating the supply of commodities or by raising interest rates but when the inflation is driven by external factors how can we control it with these measures? Though, I’m not much of an economist but I feel there could have been better ways to reduce inflation than this. I’m shocked at how horribly wrong the Govt. was. According to this news report the Central Government had said on April 19, 2008 (when the inflation was 7.14%) that they would bring down the inflation under 5% in the next two months.

Well, about crude prices the sky seems to be the limit to which the crude prices can go? Will this never end? Will crude go to $200 a barrel? When I don’t understand anything I make use of technical analysis. But I have done the technical analysis of crude in an
earlier post too with the help of Elliott Waves and had suggested that crude could make a high near 6300 or $148.50. Things have changed today. Crude, after a $10 jump that day slowed down and is now gradually inching up. This gradual increase has pushed the target upto between 6500 and 6600 (in rupees), which means it could go upto $157 a barrel. But I also saw the short term chart of crude and I found it to have some similarities with the chart of the Nifty. Let us see how.

Nifty Daily Chart - Series of Dojis and ADX

Seen above is the daily chart of the Nifty showing the period between November 2007 and January 2008. Significant in this chart is the presence of dojis. I’ve mentioned in numerous other posts that a doji is a day when the open and the close of the day is the same or is very close to each other. In this case, the candle that is formed has an upper shadow and a lower shadow but a non-existent or a very small body. All such dojis have been marked in the chart above with green arrows. Dojis are signs of indecision/confusion. Such indecisions and confusions cause a strong trend in the market to slow down and then reverse. This is exactly what happened in late January after a series of dojis were seen in late November, all of December and the initial part of January. Another thing to note in the chart is the presence of the ADX index which measures the strength of a trend. A strongly trending stock/index will show higher values of ADX while a trend slowing down or a stock/index going through a consolidation will show lower values of ADX. This ADX, which was as high as 47 in late October came down between 15 and 20, when the Nifty actually reversed.

Crude Oil Daily Chart - Series of Dojis and ADX

Let us look at the crude chart for the period between mid May and now. The similarities seen are obvious. This chart also has seen a number of dojis in the last two months, though, may not be as many as were seen in the chart of the Nifty. Looking at the ADX indicator, we can see that here too it made a high of 47 and then came down to levels between 25 and 30 and is now at 33. The striking resemblance between the two charts shows us that the high for crude oil may not be very far off. What also cannot be ignored is the presence of so many red candles. The chart looks more red than blue even though this chart is of a period when it has been in an uptrend.

Dow Jones Daily Chart - Trendline and RSI

And lastly, let us take a look at the American markets too. Seen above is the chart of Dow Jones Industrial Average for a period of last one year. We can clearly see that the trend has been downwards. The chart currently shows no indications of the downtrend finishing or an uptrend building up. But there are a couple of things which I want to share with you. The first is the trendline drawn from June 7, 2007 till date. This trendline shows that there may be support nearby near 11100. And a one year long trendline, which has been tested 4 times in the past should provide a pretty strong support. Secondly, the Relative Strength Index (RSI) is currently near 20 and considering that the downtrend has been in place for the last 9 months, a level of 20 is highly oversold which has never been seen in the last year, at least. Both these things show that a support, could only be a short term support, is nearby. And that is what we are expecting with the Indian markets too. More downside possible but a short-term low may have been formed.

Please do
subscribe to my posts, so that all posts are delivered free to your inbox and you don't miss any useful analysis of the markets in the future.

Happy Investing!!!

Thursday, July 3, 2008

Short Term Uptrend Above 4105

Yesterday the Nifty had gone up almost 200 points but all those gains were washed away today at one point but finally in the mid afternoon session the Nifty did move up a little. In the end it closed 167 points down from yesterday’s close and only 29 points above Tuesday’s close. A total range of 259 points in 3 days but only 29 points up! Yesterday we had suggested that the Nifty, if it were to cross above its resistance line would go up but the Nifty decided to turn around from there rather than to go up.

Nifty 30 minutes Chart - Trendlines

Attached is the 30 minutes chart of the Nifty which shows the inability of the Nifty to cross its resistance line. According to the dictionary, a trend is defined as the general direction in which something tends to move. With the markets it sometimes becomes difficult to determine whether the prices are moving up or moving down. In the chart attached above one can see that in the last 10 days or so the trend is down since prices are moving down. But what about the last two days? Are we in an uptrend or in a downtrend? Has the trend changed to up? If not, when can we say that the trend has changed? Well, that is why we use trendlines. Trendlines are drawn by connecting two or more successive pivot highs in case of a downtrend and two or more successive pivot lows in case of an uptrend. When the prices breach the trendline, we say that the trend has reversed. But in some cases the trend continues in the same direction but only slows down a bit after crossing the trendline. Which is why we say that a confirmation of a reversal comes only when the price starts making higher highs and higher lows OR lower highs and lower lows, as the case may be.

In the chart above, as far as the trendlines are concerned we will come back into an uptrend if the Nifty were to go above 4040 and in a downtrend if it were to go below 3890. We can see that the Nifty has already made a higher low and as soon as a higher high is made, we will be back in an uptrend. A higher high would be made if the Nifty were to cross 4105, which has changed from 4325 since the most recent pivot high was formed yesterday at 4105. A downtrend would be confirmed if the Nifty were to go below today’s low of 3875, which happens to be the most recent pivot low. As to predicting what will happen, we shall let the market decide what it wants to do. But indications are positive. The Relative Strength Index (RSI) found support at 40 today and reversed from there which is a bullish sign. At the moment the Dow Jones Industrial Average (DJIA) is trading about 75 points higher, crude is trading at about $144, which is off its highs near $145.80. And if Asian markets remain good in the morning, we can expect a positive opening. The only thing that worries me for tomorrow is the inflation figures which will be made public at noon. I’m expecting inflation to increase to around 11.6%. Anything more than that should be negative for the markets.

Please do
subscribe to my posts, so that all posts are delivered free to your inbox and you don't miss any useful analysis of the markets in the future.

Happy Investing!!!

Wednesday, July 2, 2008

Expect More Bounce in the Short Term

The Nifty opened flat, went up in the first 15-20 minutes after opening but soon started coming down. The support at 3882/3878 was soon broken and it took the Nifty to make a new low at 3848 before it started moving up again. And what a rally it was! A 200 point rally in just 2 hours of trading (between 1PM and 3PM) ensued without any correction whatsoever. On the 5 minutes charts, there were only two candles during that period which had a low lower than the low of the previous candle. In the last 30 minutes the Nifty did display some resistance near 4100.

Nifty 30 minutes Chart - Short Term Bounce Back Possible

I have attached the 30 minutes chart of the Nifty today which shows the fantastic rally that took place today. There were no complaints from the rally today, except that it fell just short of confirming the uptrend. As we can see from the charts, the rally stopped exactly at the resistance line. Thankfully, the Relative Strength Index (RSI) has given an indication that the rally may go past the resistance line. It has done so by itself going above the line that was providing resistance to it. A confirmation using the trendline technique will come if the Nifty were to cross this resistance line. If we are using the Dow Theory then a short term uptrend would be confirmed only if it were to cross its most recent pivot high which lies at 4325 as shown by the dashed green line. But one should remember that would be confirmation of only a short term uptrend. An intermediate term uptrend would be confirmed only if the Nifty were to cross 4680.

But why did the market bounce back today? Why were we not expecting a bounce back? Well, the answer is that’s what happens in a capitulation. The capitulation day makes the market so negative that everybody is expecting it to go down. All investors are bearish, all analysts are bearish, all charts are bearish and there is a lot of pessimism around. Though, there are signals available that capitulation is coming, yet the market decides when it has capitulated completely. As mentioned in
yesterday’s post, capitulation like symptoms were visible, but I personally feel the market hasn’t completely capitulated yet. Of course, that is my personal opinion and I could be wrong too. I support my reasoning with the logic that a capitulation is much sharper and lasts much longer than what was seen in the last 3-4 days.

The main reasons why the markets went up today, in my opinion, were mainly political and also valuation based. It seems certain now that the Samajwadi Party (SP) would provide support to the government on the nuclear deal issue in case of a Left pull-out. It also seems certain that the government would not fall even if the Left pulls out and that the nuclear deal might go through. While this rally is just discounting the positive developments, we should see a big rally when the nuclear deal goes through without the government falling. Looking at the valuations, Nifty, which was trading at a P/E (Price to Earnings Ratio) of over 28 in early January was down to 16.66 yesterday (based on current earnings – Forward P/E would be even lower). The Nifty Midcap 50 Index was even more attractive. The P/E which was close to 25 in January was down to only 10.15 yesterday. And a P/E of 10-15 times is a very good level to pick up stocks. But fundamentally speaking, high crude prices and inflation still remain areas of concern.

So, what do we do? Is it a bear market rally or the beginning of a bull market? We don’t know for sure right now and the best thing to do would be to follow the market and wait for it to tell us what to do. We should go long in the short term if a short term uptrend is confirmed (with proper stop losses, of course). More positions for a longer term can then be added when an intermediate term uptrend is also confirmed. In case the market comes down without confirming an intermediate term uptrend, we would know that it was just a bear market rally.

Please do
subscribe to my posts, so that all posts are delivered free to your inbox and you don't miss any useful analysis of the markets in the future.

Happy Investing!!!