Monday, June 30, 2008

Below 4000, More Downside Possible

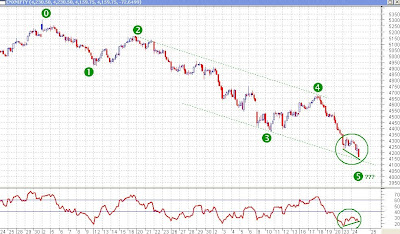
Surprisingly, the markets did not open with a negative bias today and in fact started gaining ground in the beginning of the day. But the good times didn’t last long, in fact, not even a full hour and by 11AM, the markets began their southward journey, and finally found a little bit of support near 4020 at 3PM which held till the closing bell. The break of the support at 4093 (most recent pivot low) was a big negative for the Nifty. The Nifty eventually closed at 4040.55, which happens to be the lowest close since 20th April 2007.

This also means that our Elliott Wave counts of 1,2,3,4,5 of corrective wave C, as mentioned in one of the previous posts has gone wrong. It also means that the fifth wave has not ended as yet. This means that the fifth wave is also an extended wave. We don’t know how long it will be. What we know is that it cannot be longer than the third wave. The third wave started at 5167.40 on May 16, 2008 and ended at 4369.80 (assuming that to be the end of wave 3) on June 10, 2008, thus measuring 797.60 points. The fifth wave started on June 18, 2008 at 4679.75. This means that the wave five cannot go below 3882.15 in any case. If it does then it means that our wave counting is wrong again and that we may still be in wave 3 of major corrective wave C.

Nifty Daily Chart - Elliott Waves and Bollinger Bands

For tomorrow we have support between 3970 and 4000, as was seen in the chart shown yesterday. According to the Elliott Wave Counts (assuming them to be correct), we do not expect the final low for the Nifty below 3882.15. So, we may be looking at support between 3882 and 4000. Shown above is the daily chart of Nifty with Elliott Wave Counts and with the Bollinger Bands. The close of the Nifty today was below the lower band, and as mentioned in an earlier post, it means that if the close does not come back within the band tomorrow then we may be looking at more downside. It effectively means that if it breaks 4000 tomorrow then we may be looking at a target near 3882.

The political situation also worsened (or improved??) today. The Prime Minister has decided to go and attend the G8 summit. The Left has taken it as a signal that the Government has decided to go ahead with the nuclear deal and reiterated, once again, that it would withdraw support if it did so. To make matters worse, the Prime Minister said that “there has been nothing new with the Left’s stand”. The political analysts view his confidence as a confirmation that the Government is confident of getting the support of the Samajwadi Party (SP) in case the Left withdraws support. With the UPA tally at 225 and adding 39 as the SP support the UPA still falls 8 short of the magic number of 272 to get a majority. However, getting the support of 8 more may not be too difficult a problem for the government. In case it does get the support, it would mean that the nuclear deal would go through and the government also will not fall. With the Left out of the way, the Government actually may be able to take some positive decisions (not saying that it has too much of time to do that since elections are due in May next year). That would be an ideal situation for the markets to begin a new bull market.

But inflation would still remain a concern and the market may probably be looking at a stabilization in the inflation rates before starting to go up again. With the world commodity prices still increasing and crude on the rise again, and the effect of the petrol price hike last month trickling down to other industries, the inflation figures are likely to become worse at least for another month or two, before stabilizing.

Please do
subscribe to my posts, so that all posts are delivered free to your inbox and you don't miss any useful analysis of the markets in the future.

Happy Investing!!!

Sunday, June 29, 2008

Weak Opening on Nifty Likely

After two days of impressive gains, the Nifty fell flat on its face on Friday to reach near the earlier lows near 4100. It was mainly because of highly negative global cues. The Dow Jones and Nasdaq were both heavily down. The European markets were down and so were the Asian markets on Friday. On account of global cues, Friday wasn’t a good day either, with the Dow Jones falling more than a hundred points and the European markets also closing about half a percent down except the FTSE 100 which kept trading with a negative bias throughout the day but closed just a touch in the green. This makes us realize that if Asian makets are no better on Monday then we are looking at another weak opening which will push us below the previous lows, which lies only 43 points below Friday’s closing value of the Nifty.

When there is no sense of optimism left in the markets, it makes predicting the lows very difficult. This is the most difficult times of the markets. Optimism is just not present near the end of the bear markets and in the beginning of bull markets. Every rise is seen with skepticism and supports break relentlessly. Maybe our prediction of spending 34 weeks (or 55 weeks) in the bear market is coming out to be correct.

Earlier Nifty Prediction

A screenshot of what I had written then is given above. When there is no optimism present, we don’t know which support is strong enough to hold and which weak enough to break. We can’t predict the lows but we can look for supports.

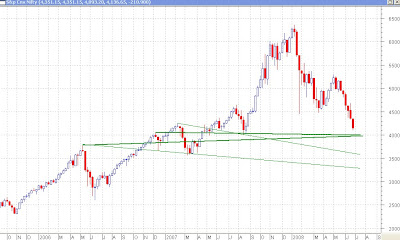
Nifty Weekly Chart - Possible Supports

I leave you today with the weekly chart of Nifty with some possible support lines drawn on the chart. The nearest ones have been drawn as thick green lines while the lower supports have been drawn as thin ones. It can be clearly seen that there are two supports near 4000, one near 3500 and another near 3100. It is also expected that 4000 being a round number will provide some psychological support too.

I just used a sentence in the previous paragraph that optimism is just not present near the end of the bear markets and in the beginning of bull markets. Does that mean that we are near the end of the bear market? Well, nothing can be said as of now. We may be near the end or we may be just 6 months into a long 2 to 2 and a half year bear market. All I can say, at the moment, is that while optimism is absent these days, bear markets always tend to finish with a lot of panic and a capitulation. Incidentally, that too has been absent right now. But, at present, the 4100 level is of a lot of importance. With weak global cues, 4100 may be broken tomorrow. But if it remains below 4100 for an extended period of time (about 2-3 hours into the opening) then we may be looking at more downside. With no optimism present, it is needless to say that one should refrain from taking any long positions in the short or medium term. While it does not make sense to take long term plus positions also, I feel that over a longer term period, timing the market is not of much importance. Fundamentally good stocks will never give you a loss if you hold them over a long term horizon. For long term investors any time is the right time.

Please do
subscribe to my posts, so that all posts are delivered free to your inbox and you don't miss any useful analysis of the markets in the future.

Happy Investing!!!
Thursday, June 26, 2008

Birth of a New Bull Market?

The resignation didn’t come today. Maybe it will come a few days later. Speculation is ripe that in a week’s time the UPA will meet the Left and inform them (rather than reaching a decision) that they are going to the IAEA (International Atomic Energy Agency) to get an approval on the safeguards text. The Left has categorically stated that it ‘will not allow them to go to the IAEA’. And the moment the Government goes, support would be withdrawn. The Government may not be able to garner enough votes to save itself in the event of a no-confidence motion.

Nifty 30Minutes Chart - Bullish Head and Shoulders

I have pasted above the 30 minutes chart of the Nifty. Formed over the last four days can be seen a small bullish head and shoulders formation on the Nifty. This pattern has been confirmed in the last 30 minutes. I, probably, would have expected a larger range candle in the last 30 minutes to accompany a breakout, but with profit booking possible in the last 30 minutes, a concession could be given. The target for this head and shoulders pattern is near 4430. While we are now in a short term uptrend, to confirm an intermediate term uptrend we need the Nifty to go above 4500. While head and shoulders are more reliable on daily and 60 minutes charts, they are not very trustworthy on 30 minutes/real-time and weekly/monthly charts. Had this pattern been visible on a 60 minutes chart, I would have been more convinced but it is not visible there. Another problem that I see with the pattern is that the Relative Strength Index (RSI) is finding constant resistance at 60, as marked by the circle. Its inability to go into the bullish zone may not be a very bullish sign. But we are in a short term uptrend and with the resignation not expected in the next two days, as a day trader I would be looking to go long, rather than short. As a swing trader/investor I would wait for more confirmation to determine whether this rally is just an aberration or is it for real.

A comment was posted by Sanjay in yesterday’s post asking whether we are in corrective wave C of major wave 4 or otherwise. Well, Elliott Waves Analysis is a very specialized topic and while I have a working knowledge of Elliott Waves, I wouldn’t call myself a specialist. But, as far as my knowledge goes I have tried to do an analysis of the wave counts in the cycle/super cycle degree. I would request specialists of EWs to post a comment (if they happen to chance by this post) to tell us all if our analysis seems to be correct or not.

Nifty Monthly Chart - Elliott Wave Counts

Pasted above is the monthly chart of Nifty along with the wave counts (as I perceive them). Our counts start from the low made in April 2003 at 920, the place marked ‘0’. In my opinion this wave lasted upto Jan 2004 when it made a high of 2014.65. The wave 2 corrected a little more than 61.8% of wave 1 upto a level of 1292.20 in May 2004. Then started the major wave 3 which ended in Feb 2007 after making a high of 4245.30, which turned out to be slightly more than 261.8% of wave 1 (269.77% to be more precise). One can also see another 5 wave structure in wave 3 as marked by the numbers in brown. The corrective wave 4 was rather a small correction. Wave 2 having corrected 61.8% of wave 1, one would have expected wave 4 to correct 38.2% of wave 3 to a level of 3117 but it managed to correct only 23.6% of wave 3 upto 3554.50 in March 2007. Wave 5, according to me, started from there to end in Jan 2008 at 6357.10. With the wave 5 (2802.60 points) almost as long as wave 3 (2953.10 points), yet falling short of the length of wave 3, it is in conformation to the Elliott Wave principles that wave 3 is usually the longest but never the shortest. So from Jan 2008 till now we have been in the corrective waves A,B,C of the complete bull market cycle. And, we have now, probably, seen the end of wave C after the 3-3-5 pattern that it followed while completing waves A, B and C.

From hereon, if our wave counts are correct, then our previous low of 4093.20 made yesterday should not be broken. However, there is only two things that are worrying me and the first one is the fall of the government. While the market has already discounted the fact that the government would fall, yet a sharp knee jerk reaction could come which, probably, could take us below the previous low. The other thing that is worrying me is the fact that we are only 25 weeks or 6 months into the bear market. Usually, Fibonacci numbers hold a lot of importance in the markets and one of my
previous posts mentions how the market made important highs/lows after a specific number of weeks and how that number always turned out to be a Fibonacci number. Going by that logic we should see the end of the bull market in 34 weeks which should not happen earlier than the last week of August.

Let us assume that our above logic is wrong and that our wave counts are correct. In that case a new bull market should start now. But do we expect new highs soon? No. A new bull market will always take time to build up. A long period of base-building will happen in the beginning of a bull market. There is a lot of pessimism when the first wave up of the bull wave is seen and people view it as a bear market rally rather than a bull market. The second wave down reinforces the fear that the bear market is continuing. It is only when this wave fails to go below the previous lows and another rally is seen that people realize that it is a new bull market. That is when the volumes come in and people come and buy in large numbers. Exactly the reason why the third wave is the longest wave. Then a correction comes about and the fourth wave down just cools down the overheated market and makes valuations appear a little more reasonable and the fifth wave starts. Now the people again come out in hordes to buy and think that since this is a bull market nothing could go wrong and conditions become euphoric and one knows that it is all about to end soon.
Sir John Templeton, a famous stock investor, has rightly said that “Bull markets are born on pessimism, grow on skepticism, mature on optimism, and die on euphoria.

Right now the conditions are pessimistic, there are rumours of a government fall, I am expecting the markets to stay low till end of August and there are analysts predicting the Sensex to come down to 12000 levels and there are a few analysts who are pessimistic enough to expect 9000 on the Sensex and some like me who once predicted the
target of Nifty to be 2600. There is a lot of pessimism around and I am wondering if this is the birth of a new bull market?

Please do
subscribe to my posts, so that all posts are delivered free to your inbox and you don't miss any useful analysis of the markets in the future.

Happy Investing!!!

Wednesday, June 25, 2008

Will the Prime Minister Resign Today?

Yesterday the RBI increased the CRR to 8.75% up 50 basis points and increased the repo rate also by 50 basis points to bring it to 8.5% as against the 8% that it was at currently. This was largely expected by the market, but a small and immediate reaction was to be expected, as our column had predicted yesterday. And that is what happened at the opening bell. The Nifty opened a 100 points down and immediately started recovering from there. It recovered for a couple of hours before it went into a small 30 points range for over 3 hours. Finally, it showed a brief and small spurt in prices in the last 30 minutes.

The UPA-Left meet was expected today on the nuclear deal issue and since that did not happen till the market closed, there was no reaction. It is surprising that the government has yet again managed to buy more time. This time the members of the meeting decided to meet again to ‘finalise the findings’ on the deal. While it was announced that the meeting would take place ‘in due course’, it is not expected to take place before a couple of weeks. Meanwhile, there were rumours (as reported by a news channel) that the Prime Minister, Dr. Manmohan Singh, may tender his resignation before the G8 summit which is to start on July 8, 2008. There is a report of a cabinet meeting being held at 11AM tomorrow. I wonder if Dr. Manmohan Singh will submit his resignation to the cabinet then.

Nifty 60 Minutes Chart - Elliott Wave Counts

Seen above is the same 60 minutes chart of the Nifty that was shown yesterday, except that it has been updated with today’s data. As expected and discussed in yesterday’s post, the Nifty bounced back from its wave 5 target levels after a positive divergence was seen between the Nifty and its Relative Strength Index (RSI). If this was the end of the wave 5 of the corrective wave C, it would mean that the bear trend has ended today. Is it so? Well, that is very difficult to say right now. That is the problem with the end of trends. It is not possible to say that the trend has changed unless a confirmation comes through. Unfortunately, a confirmation of the intermediate trend changing will come only if the Nifty were to cross 4680, while a warning that a trend change might occur will come if the Nifty were to cross 4530. This level may change with time. Elliott Wave specialists can say with certainty whether the trend has ended or not even before the confirmation comes. But I hear no analysts shouting from the rooftops as yet that this is the end. I, myself, am no specialist of Elliott Waves but my analysis says (considering that our wave counts are correct) this may have been the final low made by the Nifty in this downtrend. However, if Dr. Manmohan Singh does resign tomorrow, we shall have another deep knee jerk reaction which will lead to capitulation and then a final low being made. It is difficult to say whether a final low would be made now (in a day or two) or shall we have to wait till the last week of August as our analysis on Fibonacci techniques suggested in an earlier post.

The Nifty opened about 100 points down today but I wouldn’t go as far as to say that it was capitulation, mainly because there was no selling climax. In the absence of a capitulation and a selling climax, it will be very difficult (and risky) to say that a final low has been made. What options are we left with? A short term uptrend shall be signified above 4328 while an intermediate term uptrend, as already mentioned, shall be confirmed above 4680. I’m afraid, at the moment we do not have too many options but to wait and let the market tell us what it wants to do. I would be much more confident about predicting the markets after the government falls. Let us see if that does happen.

Please do
subscribe to my posts, so that all posts are delivered free to your inbox and you don't miss any useful analysis of the markets in the future.

Happy Investing!!!

Tuesday, June 24, 2008

Capitulation and Selling Climax Go Hand in Hand

The Nifty today opened flat with no global cues to follow but soon the strong downward momentum started pushing the Nifty down. It did attempt some sort of recovery in the late afternoon session, but failed miserably and closed after making a new low for the day. Today’s close was also the lowest close since 24th August 2007. It finally closed the day at 4191 while the low of the day today was 4156.10, which was again close to the 4157 support that we had mentioned in Sunday’s post.

Nifty 60 Minutes Chart - End May be Near

The market is falling with so much of momentum that all supports are being wiped out. Such kinds of fall ultimately lead to panic like situations and then capitulation. But in such situations it is difficult to predict where the bottom would be. Seen above is the 60 minutes chart of the Nifty. This chart shows the 5 wave pattern that the corrective wave C of the Nifty has been following as has been mentioned in the posts dated June 18, 2008 and June 3, 2008. One of the concepts of Elliott Waves, which was not mentioned in any of the previous posts is that you can find out the wave 3, wave 4 and wave 5 approximate targets if wave 1 and wave 2 have been formed. Now to find out the wave 5 target here, we connect the end of wave 2 and end of wave 4 with a trendline. We then draw a trendline parallel to this line which passes through the end of wave 3. This line should give the approximate target of wave 5. As one can see, the target given by this line is near 4130 and a low of 4156 was already made today. It is possible that the target is achieved early in the morning tomorrow. It is also quite possible that with the strong downward momentum this target is overshot. Only time will tell where the market will stop.

But there is another short term positive visible and that is a bullish divergence between the price and the RSI as has been marked within the circles. The price has gone on to make newer lows while the RSI is still above its previous low. This suggests that even though the price is on the way down, the internal strength in the Nifty is actually increasing which suggests that an end to this downtrend may be near.

But then I just heard the news that the RBI has increased the CRR and repo rates by 50 basis points each. While the repo rate has been increased immediately, the CRR hike is to be implemented in two steps of 25 basis points each. Our newsletter, and many other market participants, were already expecting a rate hike, as was mentioned in
yesterday’s post. A story on expressindia says that a meeting tomorrow between the Left and the Government will decide the fate of the nuclear deal and the government. The Left has made it pretty clear that if the Government decides to go ahead with the deal, it will withdraw support. The UPA allies are of the opinion that with inflation at a 13 year high, chances of a re-election in the event of snap polls are bleak and are pressurizing the government to delay the deal. However, there is strong speculation that the Prime Minister, Dr. Manmohan Singh, who has invested a lot of personal reputation in this deal, is unlikely to abandon the deal and may resign in case an agreement is not reached. If this happens, it may well mean that we are looking at a capitulation happening very soon, maybe as soon as tomorrow.

Uma, in her blog
post regarding volumes, rightly says that One of the key signs of a market that's bottoming out, is low volumes. But, the huge volumes being traded on NSE show no signs of going down. What she says is perfectly right, except in cases of a selling climax, which usually accompanies capitulation. A selling climax happens when there is a big price fall along with a huge volume expansion. The result is that there are no sellers left post-climax. The aftermath is light volumes and flat prices. This article by Devangshu Datta, a technical analyst, very well explains all about a selling climax.

In my opinion, we are going to see a selling climax and a capitulation tomorrow or the day after. The consequent behaviour of the post-capitulation markets will be, as expected, light volumes and flat prices. But we would have to go through that pain if we want the markets to improve and recover and cross their earlier highs. It may be a very difficult task because a drop of 35% from there has brought us here but to reach the same level we need a rise of 55% and not 35%. But with strong fundamentals and God’s grace even that might be possible. Who knows?

Please do
subscribe to my posts, so that all posts are delivered free to your inbox and you don't miss any useful analysis of the markets in the future.

Happy Investing!!!

Monday, June 23, 2008

Capitulation? Not yet!!!

The Indian Government, two weeks ago increased the price of petrol by Rs.5/- per litre, diesel by Rs.3/- per litre and the price of domestic LPG by Rs.50/- per cylinder. This was bound to set inflation on fire, which it did as was shown by the inflation figures zooming past 11% for the week ended 7th June 2008. Not to say, that this price hike was not needed. In fact, it was very badly needed and much earlier than when it was finally announced.

Back in 1974, India was a very poor country and when the price of crude virtually doubled overnight, India could afford no subsidies to its citizens and they had to bear the brunt of the price increase. The same happened in the US in 1979 when they abolished all subsidies and the full price of crude was passed down to the consumers, which eventually led to the demand going down. Today, India is a much richer country but none the wiser. It can afford all these subsidies which is why the price passed down to consumers is only about $60 a barrel as against the $135 a barrel ruling in international markets. This heavy subsidy artificially keeps the demand high and hence the prices. The moment the full price is passed down to consumers, the demand will go down which should bring the prices down. So, in effect, by subsidizing crude prices we are artificially keeping the demand high and hence the prices are not coming down. So, while it is increasing the subsidy burden on our government, all that money is actually going to the OPEC countries. This is very well explained by Mr. Swaminathan S Anklesaria Aiyar in a column titled Swaminomics on the Times of India. This article also got me thinking on what am I doing in India? I should instead have been in Venezuela where petrol costs only Rs.2/- a litre. Paradise. Absolute paradise.

The Nifty continued its southward journey today, but did find support between the 4230 and 4240 levels on two occasions during the day. This was very much in line with our expectations in
yesterday’s post where we had expected 4234 as one of the levels where the Nifty could find support. One of the supports was also placed at 4157. So, could the Nifty go down to that level or is 4234 the final low? The answer is, we don’t know. The markets would have to capitulate first to indicate that a reversal is possible. Capitulation happens when most of the investors lose their confidence in the markets and close their positions. Capitulation results in a panic like situation where the prices shave off quite a lot and quite fast. What happened in late January 2008 was a capitulation like situation when the markets lost about 30% from its highs in just 10 trading days. A similar situation is happening now when the markets have lost almost 10% in the last 4 trading sessions. But I don’t think a capitulation has happened yet.

With the inflation going past 11% and the repo rate being only 8%, all our investments in fixed deposits are now earning negative returns. This imbalance in the bank rates and the inflation cannot be maintained for long. The RBI shall have to intervene and increase the rates by at least a 100 basis points (could be in 2-3 steps rather than in one go) and such measures would have to be taken much before the scheduled credit policy meeting due on July 29, 2008. The market has already started discounting rate hikes into the prices but a strong reaction, albeit short, will be expected when the rates are actually hiked. Probably that will be the day of capitulation.

The 17 MPs (Members of Parliament) of BSP (Bahujan Samaj Party) have already withdrawn support from the UPA (United Progressive Alliance) Government on fears of the Government’s increasing proximity to the JD (Janata Dal) and the SP (Samajwadi Party). The Government is taking all steps possible to go through with the nuclear deal without forcing the Left Front to take drastic action. I wonder if they would be able to pull it off. The Prime Minister, Mr. Manmohan Singh, is already looking for reasons to resign. While the present government falling can only benefit the country, I doubt the market will take it that positively. Probably that will be the day of capitulation.

Nobody knows when that day of capitulation will come or how far down will the markets go or how much pain is still left. But one thing is for sure, the day the capitulation comes, we shall know. Such days are usually accompanied with huge and steep declines and extreme panic. The panic will build a lot of fear in everybody’s minds. But believe me, only the courageous few who decide to buy on such a day will end up as winners. Others shall see the opportunity come and then see it go. It is important to set aside your emotions of panic and fear on such a day and be as greedy as you can. As Warren Buffett says, "Be greedy when others are fearful and be fearful when others are greedy".

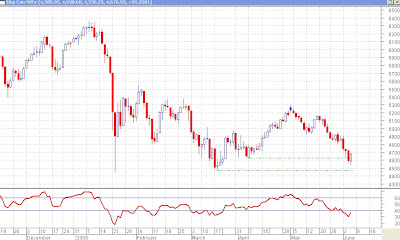
I leave you today with two charts, the top being the daily chart of the Nifty while the one at the bottom being the weekly chart. Both are giving contradictory views and my views are pasted on the charts itself. The market may follow one of the views. It is also possible that it follows one view for a short period of time (2-3 days to a week) and then follow the other view. What it finally decides to do, only time will tell.

Nifty Daily Chart - Bears Take Control
Nifty Weekly Chart - Will Support be Found Here?


Please do
subscribe to my posts, so that all posts are delivered free to your inbox and you don't miss any useful analysis of the markets in the future.

Happy Investing!!!
Sunday, June 22, 2008

Fibonacci Time Zones on Nifty

I’ve written a number of posts about the Fibonacci Series and the importance of Fibonacci numbers in the stock markets including a webinar on the Fibonacci sequence. A few of such posts have been listed near the end of this post.

The Fibonacci Series was given by an Italian Mathematician by the name of Leonardo of Pisa (1170-1250AD), who was also known as Leonardo Pisano, Leonardo Bonacci, Leonardo Fibonacci or simply Fibonacci. A very interesting story is attached to why he was called Fibonacci. Leonardo’s father Guglielmo was nicknamed Bonaccio (meaning ‘good-natured’ or ‘simple’) by his friends and Leonardo was called filius bonacci (which means son of Bonaccio) which was later nicknamed Fibonacci.

The Fibonacci Series is a series of numbers which starts from 0 and 1 and each of the succeeding numbers in the series is derived by adding the previous two numbers in the series. So it goes as 0, 1, 1, 2, 3, 5, 8, 13, 21, 34, 55, 89, 144, 233, 377 and so on. Each number is 1.618 times its previous number, 2.618 times the number before that and 4.236 times the number before that. Similarly, each number is 0.618 times its next number, 0.382 times the number after that and 0.236 times the number after that.

Fibonacci is present everywhere in nature and
this video very well describes it. Needless to say, even the stock markets rely heavily on it. Elliott Wave Principle says that markets move in a direction in a series of 8 waves out of which 5 waves are in the direction of the trend and 3 move counter to the trend. Interestingly, all three numbers 3, 5 and 8 are Fibonacci numbers. It is a known principle that when markets retrace a particular move, they generally find support/resistance at Fibonacci ratios which is why the ratios 23.6%, 38.2%, 61.8%, 161.8%, 261.8% and 423.6% hold a lot of importance. A lot of material can be found on various Fibonacci techniques used in the stock markets such as the Fibonacci retracements, Fibonacci Arcs, Fibonacci Fan Lines etc. However, I am concentrating today’s discussion on the Fibonacci Time Zones. According to the Investopedia, the Fibonacci numbers play an important role in determining relative areas where the prices of financial assets experience large price moves or change direction. There are various examples which show that markets show a high range candle or change direction on the 3rd day, 5th day, 8th day, 13th day, 21st day, 34th day, 55th day and so on. Today’s discussion, however, won’t delve into high range candles but will only concentrate on change of direction.

Before I go deeper into the subject, I would very quickly like to emphasize how the Fibonacci numbers affect the markets naturally. A week consists of 5 trading days (a Fibonacci number), a month consists of 21 or 22 trading days (21, again being a Fibonacci number) and a year consists of 245-250 trading days (being very close to the 233 Fibonacci number). Interestingly, a year has 52 weeks (very close to the 55 Fibonacci number) and 8 weeks consist of 56 days (close to the 55 Fibonacci) and 8 months consist of 240 days which again is quite close to the 233 Fibonacci mark. So, Fibonacci occurs naturally. Nobody had any real intention of making the markets respond to Fibonacci numbers but they naturally do.

Nifty Weekly Chart - Fibonacci Time Zones


I have the weekly chart of the Nifty above, and on it I have drawn vertical lines where a significant market top or a market bottom was formed. Then I have calculated the distance between the top and the next or the previous bottoms and written the number of weeks taken to reach the next low/high. As can be seen from the numbers the market has been consistently making use of Fibonacci numbers like 3, 5, 8, 21 (on some occasions it has deviated to 20 or 22 also) and 34 (though, on one occasion it took 35 weeks) to turn around right from the low formed in May 2003 till Jan 2008. Another interesting thing to note is that the bull market that started in May 2003 and ended in Jan 2008 has taken a total of 55 months, 55 again being a Fibonacci number. Interestingly, the turnaround that happened in Jan 2008 and which has been continuing till now has now completed 24 weeks and is now in the 6th month which has decisively crossed the 21 number mark and the Fibonacci number 5. It means that the markets may not turn around till 34 weeks or 8 months are completed or if things do turn out to be very bad then maybe 55 weeks or 13 months. But we should be looking at the last week of August very carefully as a possible turnaround time because that is when the markets would have completed 34 weeks of a downtrend.

But what about the downside? How low can go the markets go? Let us make use of the Fibonacci retracements this time. The Nifty made significant lows of 599.51 in March 1993, 800 in Nov 1998 and 920 in April 2003 and a significant high of 6357.10 in January 2008 (I can’t help noticing that these are spaced more or less 5 years apart, 5 again being a Fibonacci number). Calculating the 38.2% retracement levels from these different lows to the same high of 6357, we get the support levels of 4280, 4234 and 4157. These are some of the levels where the markets should eventually find support.

I heard an analyst speaking on TV a few days back who was saying that after a long bull market a correction in price as well as time is required. He was saying that we may have seen two thirds or more of the price wise correction but have seen only a third of the pain. He said that in the weeks to come, the price may not fall too much but a lot of pain will be there, which is imminent if the markets were near the support and the bulls and the bears continue to fight near a particular level trying to decide what an appropriate bottom for the market is. Even after the bottom is formed, the pain will not be over since, then the market could go into a long period of consolidation and base building before a significant recovery in price is seen. If this were to be true, we may see a bottom being formed in the last week of August 2008 but a significant price increase (maybe a breakthrough above 4700 or maybe 5000) may not be seen for the rest of the year.

We have tried and have made an effort to analyse what the market may do but, ultimately, the markets have a mind of their own and can prove us wrong anytime. We have to be quick and humble enough to accept our mistakes and change our stance if the markets were to prove us wrong. On the other hand, if the market does move according to our wishes then we know the price levels and the approximate time where we can be more careful and decide whether the market has a mind of proving us right or not. As I said, technical analysis is all about
the probability of profitability.

Please do
subscribe to my posts, so that all posts are delivered free to your inbox and you don't miss any useful analysis of the markets in the future.

Happy Investing!!!

Wednesday, June 18, 2008

4th Wave of Corrective Wave C Seems to have Ended

Finally, I’m back after a long break but can’t say for how long! I’ve had a pretty bad case of an infection which is just refusing to leave. After 4 days of antibiotics being injected into me, the high fever ranging between 103-104 degrees Fahrenheit seems to have relented. But I’ve also been having this real bad pain in the back (which, according to the doctors is related to the infection) which gives in only to painkillers and that too for only 4-5 hours. The bad part is that I can take the next doze of the painkiller only 8 hours after the previous doze and the last 3 hours are just unbearable. Today, I have taken the painkiller about 3 hours ago and I have about another hour or so to finish before I start getting the pains again. Hope I can finish what I have to say in that much time otherwise I’ll have to just upload it midway. So please excuse an abrupt ending to this edition, if there is any.

Nifty 30 minutes - Fibonacci Retracements

Seen above is the 30 minutes chart of the Nifty. As per the last analysis that I had done I had suggested that if the Nifty were to go above 4560, it could go on to find resistance at the 38.2% Fibonacci retracement level of 4675. It just so happened that the Nifty made a high of 4673.10 today before it changed its direction and started its move down.

Nifty Daily Chart - Elliott Wave Counts

Let us take a look at the daily chart of the Nifty and also look at the previous Elliott Wave Count analysis done on 3rd June, 2008. This analysis had talked about the Nifty being in the corrective wave C in which the waves A-B-C are following the 3-3-5 formation which means 3 waves each in waves A and B and 5 waves in wave C. The Nifty seems to be moving as per our analysis and now seems to have completed wave 4 and has probably started the fifth wave down of the corrective wave C today. The end of this wave shall signify the end of the bear trend. Considering this 5th wave to be as long as the first wave of this corrective wave C, we get a minimum target of 4295 and maximum of 3882 for the end of the 5th wave. Anything outside these levels would signify that our wave counting has gone awry. I, personally, am looking at a target in the vicinity of 4100.

Please do
subscribe to my posts, so that all posts are delivered free to your inbox and you don't miss any useful analysis of the markets in the future.

Happy Investing!!!


Thursday, June 12, 2008

Down With Fever, No Analysis Today

Hi Everybody! As much as I wanted to write today but I just won't be able to do it. I am down with high fever and can't sit on the computer for long. My eyes are already sore and I'm sleepy too. Will try to be back with the weekend newsletter but just don't know how things will pan out over the weekend. All I can say about the markets tomorrow is, keep an eye on the inflation numbers at around noon tomorrow. It was 8.24% last week and is expected to cross 8.5% tomorrow. Any significant increase may put some downward pressure on the markets.

But please do subscribe to my posts, so that all posts are delivered free to your inbox and you don't miss any useful analysis of the markets in the future.

Happy Investing!!!

Wednesday, June 11, 2008

Repo Rate Hiked, No Major Reaction Expected

The Nifty opened in the positive today and then had a few volatile sessions where the market was taken up, brought down, taken up again, brought down again and stayed in a range of 4490-4540 throughout the day. It finally closed the day at 4523, 73 points in the green.

Before I delve further into the newsletter, I must apologise for posting just the charts yesterday without much analysis and commentary. Actually, it was pretty late when I started last night and was already feeling sleepy when I started.

Nifty 30 minutes Chart - Fibonacci Retracements and RSI

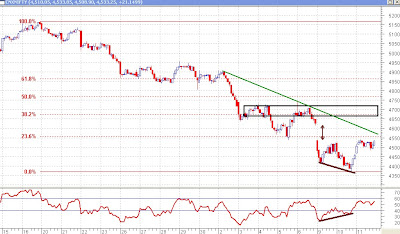
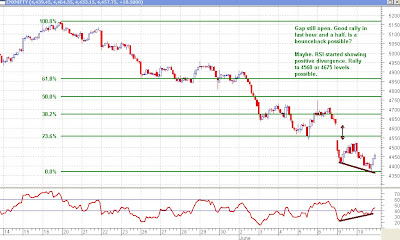
Today, I have the 30 minutes chart of the Nifty for you. A little bit of on-the-chart-analysis yesterday told you that there was some positive divergence visible between the price and the Relative Strength Index (RSI). A positive divergence, or a bullish divergence, occurs when the price is making a lower low or a lower high and an oscillator indicator (like RSI, MACD, Momentum, Rate of Change etc.) makes higher lows or higher highs during the same period. This positive divergence has been marked by the thick brown lines in the chart.

Another area on the chart marked by a brown double sided arrow is the gap created three days ago which still remains unfilled. One of the characteristics of a gap is that they are either filled very quickly or remain unfilled for a long time. This gap should have been filled by now. The reluctance of the price today to go into the gap territory is clearly visible on the chart. This may not be a very good sign for the markets. A double resistance is close by at 4560 which is the 23.6% Fibonacci retracement level and the green coloured downward sloping trendline.

In case the Nifty were to cross this resistance, it should go on to fill the gap and reach the 38.2% retracement level at 4675 or find resistance somewhere within the zone of resistance marked by the black rectangle between 4670 and 4720. The RBI has increased the repo rate by 25 basis points from 7.75% to 8%. A major part of the market was expecting some sort of intervention, following the petrol and diesel hike, by the RBI before their next credit policy which is due in July end. Since a major part of the market was expecting a hike, it may have an immediate knee jerk negative reaction on the markets but no major downside owing to the rate hike is expected. Of course, a major downside based on technical factors (like the gap not being filled or the previous low of 4370 being broken) cannot be ruled out. The best thing would be still to maintain a cautious view.

Please do
subscribe to my posts, so that you don't miss any useful analysis of the markets in the future.

Happy Investing!!!

Tuesday, June 10, 2008

Nifty Goes Sub-4400 Levels Intraday, Then Recovers

I had to go out in the evening somewhere and have just returned home and we are already closing in on midnight. While I have access to internet and charts at home, detailed analysis is likely to take time. So, will not go into any commentaries of any sort today. Will just throw in a couple of charts and leave a few comments on the charts itself.

Nifty Daily Chart

Nifty Daily Chart - Bollinger Bands Nifty 30 minutes Chart

Nifty 30 minutes Chart - Fibonacci Retracements
Please do
subscribe to my posts, so that you don't miss any useful analysis of the markets in the future.

Happy Investing!!!

Monday, June 9, 2008

Nifty Technical Analysis: A Mixed Perspective

The Nifty, as expected, opened deep in the red and a little bit of support was found near 4465, which didn’t last too long, and the Nifty continued to go deeper in the red till it found support at 4412, much lower than the January and March lows. From there a recovery came about but with regular corrections every 50 points or so. Finally, the Nifty ended the day much lower than Friday’s close, but luckily above the three supports we talked about in yesterday’s post.

Nifty 30 minutes - Fibonacci Retracements and Gap

Seen above is the 30 minutes chart of the Nifty. As can be clearly seen, and as has been marked with the double sided brown arrow, the Nifty opened with a big gap of about 78 points. Even though the markets recovered from the lows, they did not go into the price territory of the gap created. A common principle of gaps is that markets do not like them and they want to fill/close the gaps as soon as possible. The Nifty’s last trade took place at 4516 but after calculating the last 30 minutes average the closing price was derived at 4500. One positive visible is that even though the January and March lows were breached on an intraday basis, they were not breached on a closing basis and this breach is not decisive till it is breached on a closing basis. So, we may see an attempt to fill the gap in a day or two.

I’ve also drawn the Fibonacci retracements for the decline from the top made on 16th May till the bottom made today. In one of my previous posts titled “
Another Attempt at Elliott Wave Counts”, I had mentioned that we may be currently in the 3rd down wave of the C wave correction of the bull market. Now, read carefully because there are a lot of assumptions here. Assuming our wave counts of the C wave to be so far correct, we can conclude that the 2nd wave corrected the first wave by 61.8% (not visible in the chart above). And, assuming that we have seen the end of the 3rd wave today, we may expect the 4th wave to correct the 3rd wave by 38.2% or maximum upto 50% but less than 61.8%. This gives us a target of 4700 if it corrects by 38.2% and 4790 if it corrects by 50%, as can be seen in the above chart. But it could also be very well a correction of only 23.6%, in which case 4590 will provide resistance. And assuming that the 5th wave is as large (or as small) as wave 1 then we get a target of 4205 or 4315 depending on where the 4th wave ends. Hopefully, that should be the end of the bear market.

Nifty Daily Chart - Bollinger Bands

That is not the end of the analysis for today. Above, we have the daily chart of Nifty, along with the same trendline and the Bollinger Bands that we had in yesterday’s post. As seen from the chart above, the Nifty did seem to find support at the brown downward sloping trendline (considering that the close was above the trendline), but it is also evident that the close was outside the lower end of the Bollinger Band and this has bearish implications. This means that further downside is possible, as can be seen in January when the Nifty closed below the lower end of the Bollinger Band. It is also possible that a thing like what happened in March may happen again. The relevant period in March has been marked with a thick brown circle where we saw a close outside the band, then a bullish harami and then a bearish candle again closing outside the band and the markets, surprisingly, reversed from there. We have seen a similar pattern this time around where instead of a bullish harami, we have a piercing pattern and then two bearish candles as compared to one that was seen in March. So, whether we are going to see a January pattern repeat or a March pattern repeat is left to the readers’ discretion. I personally feel, it will be a repeat of the March pattern.

Please do
subscribe to my posts, so that you don't miss any useful analysis of the markets in the future.

Happy Investing!!!

Sunday, June 8, 2008

Nifty All Set to Open With a Big Gap Down

There are days when you are totally lost about what is going to happen in the markets. Today is one of those days. I have no idea whatsoever what is going to happen. I am totally lost. All the indicators are still looking weak and nothing suggests as if there is any strength that we can hope for in the markets. I need ideas from my readers about what they think about the markets right now. Are we going to go further down or are there any supports likely? Please do post your views in the comments section below this post.

Nifty Daily Chart - Bollinger Bands

Seen above is the daily chart of the Nifty. Also attached on the charts are the Bollinger Bands. It was widely believed that prices move within a band of 2-4% from their moving average, which means that prices tend to go 2-4% above their moving average, then reverse, cross the moving average downwards, go 2-4% below the moving average before reversing again. These bands were modified during bull markets, bear markets and sideways markets. Bollinger Bands work on a similar principle except that there is no need to modify the bands during different market conditions. The calculation involves the calculation of the volatility and standard deviation of the stock/index and based on that volatility the bands either contract or expand from the average. Here is a short tutorial on Bollinger Bands.

The only way to make profits in the markets is to buy low and sell high, or buy high and sell higher or sell low and buy lower. But what is low and what is high? The Nifty is near 4500 today. Is that high or is that low? If we say it is low since it is near its lows, how do we know that it will not go lower to 2600? And if it is high, how do we know that it will find support near 4500? Bollinger Bands give you no clear buy or sell signals. But they are very good at giving you ideas about what is going to happen and whether we are near the highs or the lows. Whenever in doubt, I use Bollinger Bands. When the prices are near the top of the band, we know that it is time to come down with support at the moving average and second support at the lower end of the band. Similarly, when prices are near the lower end, it may be time to reverse and go up to the moving average to find resistance there or continue to the top end of the bands. Of course, the situation changes when prices close outside the band, in which case it becomes a continuation of trend rather than a reversal.

Things are not clear even from the Bollinger Bands this time. We had three continuous closes outside the lower band in the last five days before a blue candle came and closed within the bands indicating a reversal. Things are fine upto here. This is where it starts getting messy. After this blue candle, the Indian inflation figures are declared with it increasing to 8.24% (no surprises there) and we get a red candle. The same evening crude jumps up $10 a barrel in one single day, the Dow Jones crashes by 400 points in a day and, obviously, the Asian markets will open lower on Monday. With all these global cues, our markets will definitely open with a big gap down. Now whether they will sustain those levels or come back up is another question. If they do sustain those levels and we get another close below the lower end of the band, we are in for trouble – BIG TROUBLE.

But, in case they reverse (my guess is, they should, but I could be wrong too), things may start looking a little rosy for sometime. Prices will reverse, there will be some short covering, prices shall go to the moving average between 4850 and 4900 and find resistance there and then come back again to complete the 5th wave of the C wave of this bear market, as was explained in one of my
earlier posts.

Well, there are some positives available, though the negatives heavily outnumber the positives. The Bollinger Bands create enough confusion because of which I have not added too many trendlines. In fact, I have added just one small thin dashed brown trendline (marked by the green arrow in case you miss it in all this confusion). This is providing support to the prices near 4463, we have support of the March lows at 4468 and January lows at 4448. With three supports close together, there is quite a possibility of a small reversal from here. But it all depends on how it pans out tomorrow. Dow Jones, on Friday, was down 3.13% from Thursday’s close. If our markets open with a 3.5% gap down, they should open at 4466, still above the supports. So, maybe, just maybe, there are some hopes alive.

Please do subscribe to my posts, so that you don't miss any useful analysis of the markets in the future.

Happy Investing!!!

Saturday, June 7, 2008

Inflation and Crude Oil Technical Analysis

The topic of my discussion today is crude oil. But because of the increasing oil prices we saw a hike in the prices of petrol. That will increase the inflation, so let me talk about inflation. With increasing inflation, the markets will come down, so let’s change the discussion to the markets. But this oil price increase may be because of the weakening dollar. Shall we talk about the dollar then? There are so many things to talk about, why limit ourselves to one topic. I’ll just write type whatever comes to mind.

Let us take a very simple example. Let us assume that milk and cows are not easily available commodity/animal. Let us assume that you have 5 cows with you (lucky you) and that you get about 50 litres of milk a day. Since milk is not easily available you don’t want to sell it all and would like to keep some for your future use, so you freeze it. And since your neighbours are buying from you, you sell about 28-30 litres in a day, consume 2 and freeze the rest. Now, your cows are getting old and their milk giving capacity is going down. You know that in a few months time you will be left with no milk. Your neighbours are requesting you to start selling 40-45 litres a day. Obviously, you won’t do it because when the cows stop giving milk, you could charge a fortune for a litre of milk.

Now let us say that the cows will give milk only for 6 months more, which is 180 days. At your current rate of 20 litres a day, when the cows stop giving milk you would have 3600 litres of frozen milk with you. The neighbours have been paying you with a kilo of rice for each litre of milk. But rice is easily available and its value is going down. And because of the value of rice going down, you have started asking for 1.2 kg of rice for every litre of milk. And because you are selling less your neighbours are even willing to pay 1.5 kg of rice for a litre of milk. You know that your 3600 litres of milk which was worth 3600 kg of rice, will now get you 5400 kg of rice. So, in effect you are richer by 1800 kg of rice without doing a thing. Would you sell more milk or just keep building up your wealth which is now increasing without even selling?

This is exactly what is happening in the world today. Just substitute crude oil for milk, the oil rigs for the cows, the Arabian countries owning the oil rigs for yourself, the rest of the world for the neighbours and the US dollar for rice. It is all so simple. Why would they sell more oil when their net worth is increasing every day because of the depreciating dollar? Why would they sell more when they know that 20-30 years down the line when the production is zero, the crude will be worth much more? Why would they sell more when they could get a fortune for a barrel of oil 30 years down the line?

Inflation jumped to 8.24% for the week ended May 24, 2008. On Wednesday, the government hiked the price of petrol by Rs.5/- per litre, diesel by Rs.3/- per litre and LPG by Rs.50/- per cylinder. The government says this hike could increase the inflation by 50 or 60 basis points. But inflation is not only affected by fuel price hike. This fuel price hike will have a cascading impact on all sectors from industries to agriculture and even services. The worst hit, as is easy to understand, will be the transportation sector. It will also mean increased house rents because the cost of construction material will be pushed up by the cost of transportation. And since almost everything needs to be transported before and after production, this hike would affect everything. In time, the food will also becoming dearer, and now with the LPG hike even cooking the food is going to become costlier.

The
Economic Times says that historically a Rs.2/- per litre hike in petrol and Rs.1/- per litre hike in oil pushes up the wholesale price index by more than a point in the subsequent two weeks. The LPG price had not been increased since 2004 and this time with a Rs.50/- per cylinder hike in LPG and Rs.5/- and Rs.3/- hike in petrol and diesel respectively, the wholesale price index could move up about 4 points (though the Economic Times says only a point and a half) in the week ended 7th June, the figures for which will be released on 20th June, 2008. This would push the wholesale price index to about 234.5 to 235. A figure of 235 would translate into an inflation of over 10.48% since last year in June the Wholesale Price Index was 211.8.

Coming back to crude, the crude price jumped by more than $10 a barrel on Friday to a record high of $138.54. Did the government do something wrong in increasing the petrol, diesel and LPG prices? Absolutely not, but it came too late. This was a decision which should have been taken months ago. With the reformist finance minister, Dr. Manmohan Singh heading the government, we didn’t expect such a good economic decision to come so late in the day. But maybe the government was just waiting for the Karnataka assembly elections to get over. But the decision took more than 10 days after the elections to be announced. Every single day was adding up several crores of rupees of losses for the oil companies. But in the end such a drastic hike was a bold decision by the government. But despite that, Petrol sold in India is still about Rs.10/- per litre cheaper than what price it commands in the rest of the world. But where is it headed? $150 a barrel is not too far away and there even have been predictions of $200 by the end of the year. Let us do some technical analysis.

Crude Oil in MCX - Elliott Wave Counts

Seen above is the daily chart of crude oil near month futures listed on Multi Commodity Exchange (MCX) in Rupees. In this chart we are not taking the help of any line studies or indicators. The only thing on the basis of which we are trying to predict is the Elliott Wave Theory. Applying the Elliott Wave counts to the above chart, we can see that we are currently in the 5th wave. All waves have been marked as 1,2,3 and 4. 0 is where we have started the wave count from. You can also notice that within wave 3 also there are 5 waves which have been numbered in brown colour to avoid any confusion. Wave 1 was Rs.1076/- long while the length of wave 3 was Rs.1838/-, which clearly shows that wave 3 was the extended wave. This means that wave 5 should be, more or less, as long as Rs.1076/-. From the end of wave 4, this gives us a target of Rs.6288/- per barrel for crude when wave 5 ends. A target of Rs.6300/- would translate into a price of $148/50- per barrel in dollars. There the crude should, rather, could make a short term high, at least.

More tomorrow. Happy Investing!!!

Thursday, June 5, 2008

Candlesticks Piercing Pattern Made in Nifty Today

The Nifty today opened flat and remained so for the next 2 hours before it started slipping. It went on to make a low of 4536.25 which was very close to our support of 4530 as mentioned here. It was from here that the recovery started and what a recovery it was! A climb of more than 150 points from the day’s lows. It gave us a nice big blue candle, which was quite a relief after losing 350 points in 3 days.

Nifty Daily Chart - Piercing PatternSeen above is the daily chart of the Nifty. Looking at the last two candles, according to candlestick charting, we got a very good piercing pattern. A small image is also given below to help you understand what a piercing pattern is.

Candlesticks -  Piercing PatternThe criteria to recognise a piercing pattern is the following:
  1. The body of the first candle is black (shaded); the body of the second candle is white (unshaded).
  2. The downtrend has been evident for a good period. A long black candle occurs at the end of the trend.
  3. The second day opens lower than the trading of the prior day.
  4. The white candle closes more than halfway up the black candle.

If you notice these criteria, you would see that today’s pattern on the chart fits exactly with this. This may probably mean that this is the end of the downtrend, at least for sometime. For the time being, let us forget the head and shoulders pattern that we saw yesterday and hope for the best. More candlestick patterns can be read on this page.

I got a few mails today in response to the
post I wrote yesterday. A lot of my readers were “disheartened” by my analysis of the markets and the ‘shuddering’ thought of the Nifty possibly going to 2600. One of them even asked me to ‘give some rays of hope’. I forgot that, like a doctor keeps giving hope and comfort to his patients and his/her family members even if the survival chances are bleak, I too, with so many blog readers, need to ‘give rays of hope’ when the markets are looking bad.

Yes, I understand that I may have painted a very grim picture yesterday but I thought my readers had to be aware of what could be a possibility. It is to be understood that it is only a possibility and not a certainty. More risk averse investors should be getting out of the markets if we were to go below 4450. And how will they exit if I don’t tell them where to exit? I have to cater to all audiences and it is my duty to bring out all possible scenarios. I admit that I may have erred by not including the positives in yesterday’s post.

Well, all is not lost yet. We have support at 4530, which held today. The three year trendline (and not the eight year trendline that one of my readers got confused with) that the Nifty might break is a very long trendline and one odd going through the line is not considered as a breakdown, it needs to be consistently below the line for a week or so to get a confirmation of a breakdown. Secondly, the head and shoulders pattern shown yesterday was on the weekly charts and took a year and 4 months to form and the target could take as long to be achieved. Markets change drastically in such a long time and such large patterns are more likely to fail than short term patterns. And today’s piercing pattern boosts our morale a little. All may not be lost yet.

In my
webinar on moving averages I had mentioned that when multiple moving averages converge together or come very close to each other it means that a big movement is about to come. This is a derivative of the age old Dow Theory. One of the tenets of the Dow Theory is that ‘lines indicate movement’. By ‘lines’ Charles Dow meant the prices moving in a very narrow range or within a small rectangle. This narrow range usually indicates that a movement is about to come. About moving averages when they converge together it means the prices have been moving very close to a particular price level for long (in the present scenario the 5000 level) because of which all moving averages are also very close to each other. This indicates a ‘lull before the storm’ or that a big movement is about to come. This movement could be either up or down. On the past several occasions it has happened that after such a scenario the prices went up but they could very well go down too. This theory only states that a big movement will/may come and does not necessarily state the direction of the movement. One of my readers mistook it to mean that it meant prices would go up. In the present scenario all moving averages are pretty close to each other and they indicate that a big movement is likely anytime soon. This could be on the downside if we go below 4450 or on the upside if we cross 5300. Let us all hope for the best and let the markets decide which way they want to go.

In my
post dated 27th May 2008, I had advised buying Nifty 4800, 4700 or 4600 puts or buying a 5000 call and selling 4600 or 4500 call. Let us see with the help of this table how much profit we would have made if we had followed any of those strategies on 28th May and covered the positions today with just one lot of Nifty (50 Nifties).

Nifty Options Strategies Profits

Such good returns in a matter of only 8 days and that too when the market is going down and with a maximum investment of only Rs.16000 odd. And all these profits are on just one lot of Nifty. One with Rs.50000/- to invest could have bought 4 to 5 lots of Nifty options and could have easily ended up with more than a lakh in just eight days. Keep watching this space for more such strategies whenever they come. Subscribe to my posts now so that you don’t miss any such profitable strategies.

Happy Investing!!!

Wednesday, June 4, 2008

How Low Can the Markets Stoop?

The Nifty opened today with a slight negative bias. It remained like that for the first couple of hours or so and then staged a seemingly smart recovery but again found resistance near the highs of the day and in the afternoon, probably, when the European markets started opening that we started coming down, and pretty heavily too. It was a, virtually, one way slide for the Nifty and finally it found support at 4564.50, again very close to our support which we had been predicting between 4500 and 4550. So, yesterday’s doji could not force a turnaround for the markets. The bears weighed much more than the doji.

Nifty Daily Chart - Support BrokenAttached above is the daily chart of the Nifty. Some interesting things can be seen on this chart. First of all, our first support at 4630, the previous low formed in early April could not hold today and was broken through effortlessly. Secondly, a trendline which has been in place since August 2007 was also broken through today. This could be significant for the market. The only ray of light that we can see in this dark tunnel is the Jan and Mar lows. They could, only could, provide support to the Nifty between 4450 and 4470. Below 4450, we don’t know where the bottom is. It could be 4100 or 4200 or even lower. As of this moment, there is no strength seen in the markets. It is looking all gloomy right now.

Nifty Weekly Chart - 3 year TrendlineI was trying to see if this trendline, which has been marked with the green arrow, was very significant or not. For that I had to see whether it extended back into time or not. And it was then that I came upon a very interesting disheartening chart, the weekly chart of the Nifty. And I was shocked to find that this same trendline had actually started in April 2005 and had provided support to the Nifty 8 times in the last three years. And if this three year long trendline is decisively broken, then it could be very very significant for the market.

This is disheartening in itself that the long term bullish trend could now be broken. But what are the implications? What is the target? Can we ask the market how low it can go? The answer may be visible in this chart itself. Attached below is the same weekly chart of Nifty but zoomed in to show the period from Feb 2007 onwards. Could this be called a bearish head and shoulders pattern? Well, I’m sure it can be. The neckline, of course, is not straight but it doesn’t have to be. There are head and shoulders pattern which work very well with slanting necklines too.

Nifty Weekly Chart - Head and Shoulders?What is disheartening is the fact that the market is virtually shouting from the rooftops to exercise caution. It is telling us that it could stoop down shamelessly to levels which we cannot even think of. But, of course, only after this pattern is decisively broken. The dashed vertical line marked with the arrow shows that the high was close to 6300 when the neckline was near 4300, a difference of 2000 points. And if it is broken and the breakout is considered to be at 4600 then we are looking at a target of …. Hold your breath ….. 2600.

Can this pattern fail? Well, definitely it could. There have been various instances of head and shoulders patterns failing in the past.
Uma could vouch for that. She has experienced three head and shoulders patterns failures in Reliance in a single day. Believe me, this is one occasion where I would really hope for this pattern in Nifty to fail. I have a lot of long term positions which I would have to sell in a loss if the Nifty were to go below the previous low at 4450.

After this chart and analysis, I can’t seem to get any more words out of my mouth fingers. All I can say right now is just the three golden words – EXERCISE EXTREME CAUTION.

Please do subscribe to my posts, so that all posts are delivered free to your inbox and you don't miss any useful analysis of the markets in the future.

Happy Investing!!!

Tuesday, June 3, 2008

Another Attempt At Elliott Wave Counts

The Nifty, taking the cue from red global markets, opened weak and within minutes of opening reached 4634, very close to the support of 4630, as was mentioned in the post dated 25th May titled “Nifty Breaks Important Support”. And from there it staged a magnificient recovery. Unfortunately, the recovery wasn’t enough to take it into the green but it was enough to end the day to form a doji candle (open and close at or very close to each other), as can be seen in the chart below.

Nifty Daily Chart

As has been discussed in various earlier newsletters, a doji after a downfall is a bullish sign in the short term and the same after an upmove is a bearish short term sign. Now whether this doji is strong enough to take it up in the next 2-3 days or whether the bears win over this doji is yet to be seen. An upmove from this level could take the Nifty to 4800 where it should find resistance again. A downmove will have to go beyond 4630 to reach our estimated support between 4500 and 4550. There was probably another reason for the support found today, as can be seen from the trendline marked with the arrow.

I had written a post on April 21st titled "Are we in wave 3 of Nifty?" in which I had mentioned the basics about Elliott Waves. You can read that post before you continue ahead so that you can recall what I had written that time.

In response to that post, I received an email from a subscriber of mine who wrote the following:

“Dear Sir,

I want to ask you that are we in bullish phase, after the corrective phase of A,B,C? Previously you have written an article "Are we in wave 3?". In the same line I want to add that, now we are in WAVE 2, shortly will enter in to WAVE 3. Below I have given the image for right understanding.

Want to know your comment on it.”

He has been very kind to attach a chart also which is self explanatory and needs no commentary. It is attached below.

Elliott Wave Count - Scenario 1

While the chart is beautiful, in my view, the analysis seems to be incorrect, at least at this moment. In my earlier post, which you have just read, I had mentioned that wave 4 should never never come in the price territory of wave 1. If it does, it means that our wave count was incorrect. That counting went wrong on 9th May when the Nifty came below 4970.80 (the high of wave 1), which led to the conclusion that it was either wave 2 forming, as my subscriber suggests, or maybe some other numbering pattern. It now seems that it isn’t wave 2 also that is forming because our target for Nifty is much lower, between 4500 and 4550. If that does happen then this cannot be wave 2 because wave 2 does not, generally, retrace more than 61.8% of wave 1. In this case it has already retraced a little more than that. In my opinion, we are still in the corrective waves A-B-C, which can also take the 3-3-5 pattern which means that wave A and B would each consist of 3 waves while wave C would consist of 5 waves.

Elliott Wave Count - More Likely Scenario

In the chart above, I have numbered the waves A-B-C in large capital letters and the waves within these larger waves as 1-2-3-4-5 in smaller font. I think we have completed the 3 waves of the corrective wave A, the 3 waves of corrective wave B and are in the 3rd of 5 waves of corrective wave C. This 3rd wave could go between 4500 and 4550 from where we will have a small bounce back which would form wave 4 (not to exceed 4900) of the C wave and then a downfall again, which would take the Nifty to 4100-4200 (or lower??). That would, probably, be the end of the bear market from where it will be a new beginning. That is what the Elliott Wave Theory tells us right now. However, I must admit that I am not a master of Elliott Waves and the market could again prove my numbering to be incorrect, if it so decides. I, like all other analysts, respect the market and believe that market is supreme.

According to a1samud, there is a very famous saying by Mahatma Gandhi, which I quote below:

"A customer is the most important visitor on our premises. he is not dependent on us. We are dependent on him. He is not an interruption in our work. He is the purpose of it. He is not an outsider in our business. He is part of it. We are not doing him a favor by serving him. He is doing us a favor by giving us an opportunity to do so.”

I would like to twist it a little to fit the relationship of analysts and the markets. Here is my version of it:

"The markets are the most important element of our lives. They are not dependent on us. We are dependent on them. They are not an interruption in our work. They are the purpose of it. They are not an outsider in our business. They are a part of it. We are not doing them a favor by analysing them. They are doing us a favor by giving us an opportunity to do so.”

Please do subscribe to my posts, so that all posts are delivered free to your inbox and you don't miss any useful analysis of the markets in the future.

Happy Investing!!!