Tuesday, September 30, 2008

Food For Thought

I had some meetings today with some different people which finished late, late enough for me to come back home just before midnight. It is too late for me to start doing some analysis on Nifty and give you my opinions. But certainly, I will leave you with some links today which may act as some food for thought. Do let me know if you have any comments on the same and post them in the comments section below.

  1. Mr. Sudarshan Sukhani still feels that what we saw today was a bear market rally and I somehow agree with this view of his.
  2. Eoin Treacy of Fullermoney.com feels that India is insulated from global woes.
  3. A day after the US markets displayed their largest single day fall consequent to the bailout package being rejected by the congress, the US stocks rallied today amid speculation that the bank rescue plan will pass.

Please do subscribe to my posts, so that all posts are delivered free to your inbox and you don't miss any useful analysis of the markets in the future.

Happy Investing!!!


Monday, September 29, 2008

3800 Support on the Nifty May Not Hold

The Nifty on Friday closed at 3985 after giving bearish signals (breaking of the 4000 support). The next support was there at 3800, 185 points away from the previous close. On Sunday night, I chose to upload a webinar for my readers rather than do any analysis on the Nifty, mainly because I had been talking of a target of 3800 since a number of days and secondly, I didn’t feel Nifty could lose 185 points in one single day. And yet, it did. After losing 208 points intraday (from Friday’s close), the Nifty bounced back a little to close at 3850 with a loss of 135 points. The markets were expected to be better after the Federal Reserve’s bailout bill, which plans to induct $700 billion into the global financial system, went to the Congress for voting. But after reports that Wachovia and three other European banks were banking on the Fed rescue, the markets slumped fearing that the $700 billion bailout package may not be enough to ride over the current financial crisis.

Today, the Nifty made a low of 3777, breaking the previous 52 week low of 3790.20 made on 16th July 2008. After making a low at 3777, the Nifty immediately made a recovery, and a good one at that, to end the day at 3850. Today’s closing price became the second lowest close in the last 52 weeks, the lowest being 3816, again on 16th July 2008. Making a new 52 week low is negative for the markets, and even though the market recovered to close above 3800 today, it seems quite possible that 3800 may be broken on the downside.

Nifty Monthly Chart - Next Support at 50% Fibonacci Retracement

Seen above is the monthly chart of the Nifty. The chart shows the Fibonacci retracement levels of the rise from the much remembered low of 920 in April 2003 to the much much remembered high of 6357 made in January this year. The 38.2% retracement level support was at 4300 which was broken through, a few months ago. Since 3800 now seems to be under danger, it is important to know what the next support levels are. What provides support now is the 50% retracement level which is at 3640. Just below the 50% retracement level, is a black trendline which may act as another support if the 50% retracement level is breached. This trendline connects a few closes, a few opens and a low in the candles formed in the last couple of years. This trendline stands at 3558 and below this there is the 61.8% Fibonacci retracement level at 3000, which provides support and then the final support comes at 2600.

Of course, supports are just supports and are important only to identify where the market may stop its downmove. But the markets have a mind of their own and can decide to stop the downmove anywhere, no matter whether a support is there or not. Knowing a support level in advance helps us a bit because if the markets do decide to find support near a support level identified by us, we are better prepared to convert our ideas into an actionable long trade. I have mentioned above that it does not seem likely that the 3800 support will hold. Though, the markets suggest otherwise, I would be happy, and I’m sure a lot of other people will be happy too, if the markets prove us wrong this time and keep respecting the 3800 support.

Please do
subscribe to my posts, so that all posts are delivered free to your inbox and you don't miss any useful analysis of the markets in the future.

Happy Investing!!!

Webinar on MACD

This is the third of the series of my webinars. The first webinar was about moving averages and trendlines, the second was about Fibonacci numbers and Fibonacci ratios and this one is about the MACD. To view the old webinars, just go below this post and under the section "Related Posts", click on the posts given under the subsection webinars. In case you have any questions about the topic after you see the webinar, feel free to post your questions under the comments section below and I'll make it a point to come back to you as soon as possible.


Please do
subscribe to my posts, so that all posts are delivered free to your inbox and you don't miss any useful analysis of the markets in the future.

Happy Investing!!!

Thursday, September 25, 2008

Stochastics Too Gives Sell Signal

After flat American and Asian markets, nothing much was expected from the Indian markets too. And, as expected, the opening was nothing to talk about. Today was F&O expiry day and on F&O expiry days markets generally remain volatile. That was not the case this expiry. The Nifty, after a week opening, started going down and it wasn’t until 1:45pm that the fall stopped. But by that time, the NSE index had already shed about 80 points. A little bit of recovery came about post 2 but as the market neared closing, the movement too stopped and the Nifty slipped into a 10-15 points range after that. Today, Thursday, was a good day for the European markets and so does it look for the American markets. The London FTSE and the German DAX closed with gains of 2% while the French CAC was up 3%. The Dow Jones, at the time of writing, was trading with gains of almost 3%. Crude had increased to $108.65 intra day but had come back to $106.90.

Nifty Daily Chart - Moving Averages Provide Resistance, Stochastocs Gives Sell

Attached above is the daily chart of Nifty along with two moving averages and a stochastics oscillator. The chart has been zoomed in to show only 3 months data so that we get a closer look at the moving averages. The thick green line at the bottom is the support that the Nifty respected twice at 3800. Among the moving averages, the green one is the 21 day moving average while the brown one is the 10 day moving average. Both moving averages are important and provide good signals in their respective time frames. Here, as discussed in one of my previous newsletters, the prices had come below the 21 day exponential moving average and had given a sell signal on 11th Sep 2008. The 10 day moving average also gives similar signals, except that it gives a quicker response than a 21 day moving average. Here, the prices are below both the moving averages and both of them should provide resistance to the Nifty. The 10 day moving average provides resistance near 4170 while 4229 happens to be the level for the 21 day moving average. As regards stochastics, the 5,3 day stochastics slowed to 3 days has given us a sell signal yesterday.

With the American and European markets good today, chances are that we might open strong too. In case we don’t, or if we do and then come down then support comes in near the green line (the thinner one) near 4073-4075. A move below this level should, rather could, bring us to levels of 4000, 3950 and possibly 3800. With the new F&O series taking over tomorrow, let us see how it makes the Nifty behave.

Please do
subscribe to my posts, so that all posts are delivered free to your inbox and you don't miss any useful analysis of the markets in the future.

Happy Investing!!!

Nifty Inside Contracting Triangle, Wait for Breakout

The Nifty remained range bound today. After opening with a slight positive gap it went up a little further but shortly before 1pm, it started its downward journey. Around 3pm, after it recorded its low of the day, a little bit of recovery came about, especially in the last 30 minutes, which helped the Nifty close with a gain of about 34 points. International cues too do not suggest anything. Asian markets closed flat with a slight positive bias while European markets had a slight negative bias in them. American markets, at the moment stand completely unchanged and the Dow Jones, till now today, has had a small intraday movement of about 100 points. Crude is flat too and is currently trading near $105.

Nifty 30 Minutes Chart - Contracting Triangle with Straight Bottom, MACD suggests indecision

Seen above is the 30 minutes chart of the Nifty. As can be seen, the Nifty is making a pattern of a right angled triangle with a straight bottom. The prices, for the last four days have been contracting within this triangle. Such straight bottom triangles are essentially bearish patterns but my experience tells me that with them the direction cannot be predicted. The best way would be to wait to let the prices break out of the triangle and we then take a position in the direction of the triangle. For tomorrow, the levels are between 4115 and 4200. Buy above 4200 or sell below 4115. If the pattern is broken on the downside, then we could have a target of 3990 on the charts.

At the moment, the MACD is hovering around zero and the MACD line is moving so close to its signal line that it suggests a lot of confusion and indecision in the markets. And obviously, a contracting triangle and trend channels, in themselves, are signs of confusion.

Please do
subscribe to my posts, so that all posts are delivered free to your inbox and you don't miss any useful analysis of the markets in the future.

Happy Investing!!!

Wednesday, September 24, 2008

Nifty Falls, Ignores Island Reversal Pattern

The Nifty opened weak today, as was expected, because of the weak American and Asian markets. The Dow Jones was down 372 points overnight while all Asian markets, except Nikkei, were trading in the red with Hang Seng leading the pack, which finally closed with a loss of 759 points, down 3.87%. Followed by a weak opening, the Nifty did try to recover but the happiness lasting only about an hour or so, after which the index started its decline. Another attempt at recovery came shortly after noon but that too didn’t last long and from there it was a steady decline for the Nifty through the day. The island reversal pattern seen on the Nifty two days back was completely ignored today.

Nifty Tick By Tick - Head and Shoulders Confirmed, Target Achieved

Seen above is the tick by tick chart of the Nifty. As seen from the chart, the Nifty, early in the morning, after going to 4150 started going up, made a top near 4190, and came down to 4171.35. Then a small recovery took it past its highs of the day, went up to 4224.60 came down to 4171.35 again, climbed to 4203.30 and finally broke through 4171.35, thus completing a bearish head and shoulders pattern. With the top of the head at 4224.60 and the neckline at 4171.35, the target was 53.25 points (4224.60-4171.35) below 4171.35. This gave us a target level of 4118.10 (4171.35-53.25) on the Nifty. So, we saw a bearish head and shoulders pattern being formed, being confirmed and the target achieved, all in one day. And we can see that after this head and shoulders pattern target was achieved, there was an immediate bounce in the price from that level. This case was more like a case of a perfect head and shoulders pattern. In most cases, either the neckline is not straight, or the shoulders are not perfect or the target is not achieved or the price overshoots the target. But then, life is never perfect. One has to live it the way it is offered to us and make the best of it.

Well, that was the intra day chart for today only, but what is the forecast for tomorrow or the days after that? To try and forecast what the market would do is like trying and forecasting whether the next toss of a coin would be a heads or a tail. The market remains as unpredictable as ever and most of the times move against our wishes/forecast. But we also know that when it does move in our favour, most of the times we get a move big enough to wipe off most of our losses. That is where technical analysis comes in handy, where 7 trades out of 10 turn out to be loss making trades, but the remaining three trades are big enough to wipe the 7 losses and giving us a net profit. Technical Analysis only helps us increase the probability of making a profit. One of my previous posts title “
The Probability of Profitability” very well explains this. Well, and to do that we have to analyse to see what our analysis says.

Nifty 30 Minutes - Fibonacci Retracement Levels provide support, MACD maintains sell

Attached above is the 30 minutes chart of the Nifty, which gives us a slightly longer term view than what the intra day chart gives us. Notice that in this chart, the bearish head and shoulders pattern, which was so clear in the tick by tick chart, is not visible here. Last week we had seen the Nifty slip into a narrow range between 3950 and 4100. This range has been marked by a trend channel/rectangle. Notice that the upper end of the rectangle lies somewhere between 4090 and 4100 and not exactly 4100. Also shown in this chart is the Moving Averages Convergence Divergence (MACD) and the upper line of the rectangle extended till date. This extended line tells us that there is support available between 4090 and 4100. The MACD, which had given a sell signal yesterday, reaffirmed it today by going below the equilibrium line at 0. Notice that there is a blue coloured trendline here too which shows that there maybe support available for the MACD at current levels, which, if broken, would have bearish implications. There are also Fibonacci retracement levels drawn on the chart for the two day rise from 3800 to 4300. These Fibonacci levels tell us that the 38.2% level is still intact may (or may not) provide support at 4112. If this is breached, the next Fibonacci levels of support are at 4050 and 3995, being the 50% and the 61.8% retracement levels, respectively. For now, we can just wait and watch, which of these levels does the Nifty feel worthy enough to respect.

As far as the international markets are concerned, the London FTSE and French CAC closed with a loss of about 2% while the German DAX lost 1% of its value. American markets are more or less flat at the moment while the crude has come off its yesterday's highs and was today in the vicinity of $106 a barrel.

Please do
subscribe to my posts, so that all posts are delivered free to your inbox and you don't miss any useful analysis of the markets in the future.

Happy Investing!!!

Monday, September 22, 2008

Outlook Good for the Nifty After Island Reversal

After a fascinating run up in the Nifty in the last two days, it sure had some breath catching to do. Markets are half human, which means that if we get exhausted after a brisk run, so do the markets. And the run up seen in the last two days was much more than what we can call a ‘brisk run’. So, obviously, the markets needed some rest and they got it today. The Nifty managed to go about 50 points up in the first 30 minutes of the day and made a high of 4303 (as compared to my analysis yesterday that it had resistance at 4300). Soon enough, it started coming down and finally ended the day with a loss of 22 points while the BSE Sensex closed 47 points down. As of now, European markets closed in the red with prices paring upto 1.5% while the Dow Jones is more than 2% down. Crude has shot up to almost $128, a jump of $25 in a day. So, all international cues, at the time of writing this post, are negative.

Nifty 30 Minutes Chart - Island Reversals and Island Gaps

Seen above is the 30 minutes chart of the Nifty. We shall discuss island reversal techniques here. The Nifty on Monday last (15th Sep 2008) opened with a huge negative gap when Delhi was rocked by serial bomb blasts on Saturday, 13th Sep 2008, and Lehman Brothers in the USA declared bankruptcy. Three days later, on 18th Sep 2008, the markets opened with another big downward gap but soon recovered and the very next day it opened with a big positive gap after the US government bailed out insurance giant AIG by granting them a loan of $85 billion in return for 80% stake in the company. These gaps created a pattern known as an island reversal pattern. In such a pattern the prices open with a downward/upward gap, trade in a narrow range for sometime, and then open with another gap on the opposite side thus creating a candle or a cluster of candles to be separated from the rest of the candles. A cluster at the bottom is a bullish sign while a cluster on the top is a bearish sign. It is usually said that in case of an island reversal, chances are reasonably high that prices would return to the point from where the previous trend started. In this case the last downtrend started from 4540, so the charts suggest a rally to that level. More on island reversals can be read on Bedford and Associates and Incredible Charts. There are lot of other sites with information on island reversals. The chart above has today’s price candles inside a square which has been zoomed into and that shows another candle today which is separated from the rest of the prices, another short term bullish sign. Needless to say that an island cluster holds more significance and is more reliable than a single candle formed as an island.

Nifty 30 Minutes Chart - Fibonacci Retracements, Resistance at 61.8%

Seen above is the same 30 minutes chart of Nifty but with another set of information. We are trying to use some Fibonacci rules on this chart. The prices started coming down from a high of 4538 on 8th Sep 2008 and touched a low of 3800 on 18th Sep 2008. Then the trend reversed and the prices rallied and retraced almost 61.8% in a matter of two days as shown by the Fibonacci retracement levels in dark green and in large brown numbers. A small rest is being taken by the Nifty currently. There are two possibilities. If we are in a bear market, we could see all these gains wiped out and should see prices coming below 3800. But if we are in a bull market then the most reasonable ‘rest’ that we can expect is a retracement of 23.6% or 38.2% of the rise seen in the last two days. As seen by the Fibonacci retracement levels in light green, a 23.6% retracement should see prices down to 4190 levels while a 38.2% retracement would bring us down to 4115. As already mentioned, international cues are all negative at the moment.

Please do
subscribe to my posts, so that all posts are delivered free to your inbox and you don't miss any useful analysis of the markets in the future.

Happy Investing!!!

Sunday, September 21, 2008

Minor Resistances Close By, Short Term Trend Up

The Indian markets saw two days of amazing gains when all the world markets were displaying weakness. Bad news now does bring the markets down but the markets are not being able to sustain the weakness. The bulls have a clear advantage now, at least in the short term. On Friday the Nifty opened with an upward gap of about 100 points and surprisingly continued in the same direction. Friday, in fact, was a good day for all markets over the world. The Asian markets were between 4% and 10% up with Hang Seng leading the pack with gains of 9.61% and Shanghai following a close second with 9.46% gains. The Indian markets, as we all know, were more than 5% up with Nifty closing with gains of 207 points and BSE Sensex jumping 726 points. The European markets also closed with gains between 5 and 10% with the French CAC jumping 9.2% and London FTSE gaining 8.8%.

Nifty Daily Chart - Resistance at 21 day EMA

Seen above is the daily chart of the Nifty, which shows the big jump in the last two days. 450 points in 2 days. This rally came after the head and shoulders target was achieved at 3800, which also happened to be a major support as the lowest low (actually 3790) formed in recent times (July 2008). A rally should have come back and found resistance near the neckline at 4200 but there was not even a hint of resistance at those levels. The Nifty easily crossed 4200 and after making a high at 4262, finally ended the day at 4245. There is some bit of resistance near current levels at 4250, at 4300 and then 4350. A major resistance comes in at or near 4500. An indicator added on the charts today is a 21 day exponential moving average which usually gives very good support/resistance levels in trending markets. This can be seen on the chart shown above too. The 21 day EMA level for Friday was 4264 and the Nifty made a high of 4262.65. Coincidence? No, it happens a number of times. If this indeed is a trending market then a break above this should be decisive. Not only that, it will also then act as a support if the price were to come down. But what if it is a sideways market? Well, then we should see the price coming down below it soon enough. The moving averages have also proved, time and again, that they are useless in sideways markets.

Now since 4200 was a significant level for us and since the price has now managed to move above it on Friday, it should now act as a good support for the Nifty. One could consider buying in the short term with a stop loss at 4200. One may think of using the ‘trailing stop loss’ technique as each level of 4250, 4300 and 4350 is ticked off by the Nifty. Consider exiting beween 4450 and 4500.

Please do
subscribe to my posts, so that all posts are delivered free to your inbox and you don't miss any useful analysis of the markets in the future.

Happy Investing!!!

Friday, September 19, 2008

Rakesh Jhunjhunwala Positive On the Markets

Since a number of days now, I have been talking of a target of 3800 on the Nifty. This morning because of the global weakness the Nifty opened weak and touched that target of 3800. In fact, so close was the prediction that today’s low on the Nifty happened to be 3799.55. And once the target was achieved, the Nifty started moving up. The move up was steady and consistent and so good was the recovery that the Nifty finally managed to close near the highs of the day with a gain of 30 points. The high made today was 4050.10, which means an intraday recovery of 250.55 points. Such a good day changes the outlook totally. Crude, as of now, is trading flat near $96 while gold, after a stunning $70 rise yesterday is up again by $46 or 6%.

Nifty Daily Chart - Hammer Today and Long lower shadows suggest bullishness

Seen above is the daily chart of the Nifty. Three days out of the last four have displayed candles with long lower shadows, as marked by the green arrows. Two of these candles have very small bodies and, in comparison, very long lower shadows. Today’s candle, in candlestick charting parlance, is also called a hammer. And it is named a hammer not only because it looks like one but also because such candles are found near the end of a downtrend and it is said that such candles are ‘hammering out a base’. Options outlet says the following about a hammer.

Hammer According to Options Outlet

So, is this the end of the bear market? Well, we can’t say for sure. The prices have started ‘hammering out a base’, inflation has stabilized, crude prices have softened and India does not seem to be having too much of an impact of the credit crisis in the US. Who knows, this may be the end of the bear market. But hey, look at the world around you. There is so much of pessimism around. Surely, India cannot remain insulated from the problems in the rest of the world. Hmm, maybe it cannot. Or maybe it can. But as far as pessimism around the world is concerned, I would again like to point out what Sir John Templeton said. He said that “Bull markets are born on pessimism, grow on skepticism, mature on optimism, and die on euphoria.”

Rakesh Jhunjhunwala, according to Moneycontrol says that India is still in a long term bull market and that the current phase is only an interruption to that bull market. His logic is simple. That had we seen the market rise from 3000 to 13000 and then come down to 11000, it would have been termed as a correction. Now when we have seen so much of greed and so many excesses that the markets went to 22000 and then came down to 13000 then why are we not calling this phase a correction too? Shireen Bhan, in that context, in conversation with him mentioned that we have recently seen ‘the mother of all bull markets’ to which Rakesh Jhunjhunwala immediately disagreed and said the ‘the mother of all bull markets’ was yet to come. This conversation with Rakesh Jhunjhunwala will be telecast on CNBC this Saturday at 7:30 pm or Sunday at 10:30 pm. Watch it.

Shankar Sharma of First Global, though,
remains a bear and says that the Sensex may not be able to reconquer its previous highs for the next 2-3 years and that it may come down to 10000-11000 levels.

But Vikas, where does that leave us? Do we remain bullish or bearish? Well, I have given you both sides of the market. You decide for yourself what you want to be. I, personally, am not too bearish on the markets, especially after seeing the candles formed in the last four days.

Please do
subscribe to my posts, so that all posts are delivered free to your inbox and you don't miss any useful analysis of the markets in the future.

Happy Investing!!!

Thursday, September 18, 2008

Nifty Slips Into Another Range, Gold Shoots Up

The Nifty today opened weak, stayed weak, made a weak attempt to recover after noon but failed and became weaker after the European markets opened weak. So, there is weakness all around. The only thing that’s not weak is Gold, which went up sharply today rising $84, almost 11%.

Nifty 30 Minutes Chart - Slips Into Another Range, No divergence in RSI

After breaking down from the double top pattern formed on the 30 minutes charts a few days ago, the Nifty achieved its target at the opening bell of the third day. After achieving the target, the Nifty has now slipped into another range, this time on the 30 minutes charts, as seen above. This range is between 3950 and 4100. While the target on the daily charts remains 3800, it will be only after this range is broken through on the downside. In case the prices break out decisively above this range, that target of 3800 will be cancelled, at least for the time being.

If the prices do break out of this range on the downside, what will be the target on the 30 minutes charts? Well, this range is 150 points wide (4100-3950) and a breakdown will give us an additional 150 points which gives us a target of 3800 (3950-150). So, well, that conforms to our views/target on the daily charts.

That’s fine, but which side is the market likely to break out on? Well, we don’t know. That is what happens in a range. In a range, not only is the market confused/unsure, it confuses us too. Well, we may get some early indication from oscillator indicators when there is a divergence visible, but in this case the Relative Strength Index (RSI) is also not showing any visible divergences. This means, that we shall have to wait till a divergence is visible (which may or may not come) or for the market to come out of the range. So, for now, it is buy above 4100 and sell below 3950 (in the short term). Investors are advised to wait for now and not take any long positions, at least not till the market either achieves 3800 or breaks out on the upside above 4100.

But the international markets may provide some cues. There is some good news from the US. The Fed government has agreed to bail out AIG by giving them a $85 billion loan (that will be repaid by liquidating the company) in exchange for a 80% stake in the company. But there are fresh concerns about Morgan Stanley and Goldman Sachs (the two remaining independent securities firms), the result being that, at the moment, Dow Jones is trading 240 points in the red while the Nasdaq has lost 75 points. Crude remains flat near $97 a barrel. So, all in all, it looks like we are going to have a downside breakout from the range that we are in.

Please do
subscribe to my posts, so that all posts are delivered free to your inbox and you don't miss any useful analysis of the markets in the future.

Happy Investing!!!

Wednesday, September 17, 2008

Head and Shoulders Confirmed, Pullback to 4200 Possible

First of all I would like to apologise to my readers for not being able to post my comments on the markets yesterday. Though, I love writing and sharing my technical views with my readers, but there are days when I have meetings with clients in the evening and sometimes over dinner and those days it becomes difficult for me to post my views. Anyways, I am back today.

Saturday evening, Delhi was rocked by serial bomb blasts. By opening on Monday morning there was news that Lehman Brothers had filed for bankruptcy and that Merrill Lynch was being sold out to Bank of America. The US government confirmed today that Lehman Brothers would not be bailed out. Insurance giant, American International Group (AIG), has asked the Fed for a loan of $40 billion and it is uncertain as yet whether it would help or not. With such news floating around in the market, the markets were bound to go down and the trading range between 4200-4650 was finally broken, but on the downside.

As of today, the London FTSE closed 120 points down losing 2.3%, the German DAX lost 1.12% while the French CAC was virtually unaffected losing only 0.81%. The Asian markets were much worse today (Tuesday) with the Hong Kong Hang Seng losing 5.44%, the Japanese Nikkei 4.95%, the Shanghai index 4.47% and the Korean Kospi losing 4.6%. Compared to them, the feat which the Nifty accomplished was mind boggling. After losing more than 153 points at one point during the day, the Nifty still managed to close in the green, albeit only 2 points.

Nifty Daily Chart - Head and Shoulders Confirmed, Experiencing Pullback

Attached above is the daily chart of Nifty with the Relative Strength Index (RSI) at the bottom. As seen from the chart, the Nifty has displayed a large head and shoulders pattern formed over a period of almost two months. This bearish head and shoulders pattern gives us a target of 3800 on the charts and it is quite possible that we may achieve that. Looking at the candles formed over the last two days. Both these candles have long lower shadows and today’s candle was a doji with a very long lower shadow. This should be bullish for the market in the short term. And, technically too, in all patterns which witness a breakout, on a number of occasions there are pullbacks. In this head and shoulders breakout too, we may see a pullback which means that the prices may retrace back to 4200 or nearabouts before continuing on their way to 3800.

A few days back I received, on my blog, a
comment from Krishnamurthy, who said that he is short in Nifty since 4500 levels because he believed that Nifty had completed the 2nd wave zig zag and that had started the 3rd wave down. Krishnamurthy once sent me an e-book on Elliott Waves and gave me a couple of helpful tips. While I am a novice in Elliott Waves, Krishnamurthy has done a lot of research on it. Krishna, if you are reading this may I please invite you to contribute on my blog from time to time so that not only me, but all my readers too may benefit from your analysis. Please send in your articles to me by e-mail and I’ll post them on to the blog.

Please do
subscribe to my posts, so that all posts are delivered free to your inbox and you don't miss any useful analysis of the markets in the future.

Happy Investing!!!

Monday, September 15, 2008

Nifty At Crucial 4200 Support, Wait for Next Move

As expected the Nifty, after making a confirmed double top pattern on the 30 minutes chart, came down. Though, the target for this double top formation was 4160 but there was support on the daily charts at 4200. The Nifty respected this support, made a low of exactly 4200.15 and then recovered to end the day at 4228 to close 62 points down while the BSE Sensex ended the day with a loss of 323 points. European markets were good on Friday and ended the day with gains between a percent and 2 percent. The American markets, however, were flat. Crude also remained, more or less, flat and maintained support at $100 to end the day at $101.

Nifty Daily Chart - Support at 4200, Breakdown may see 3800

Seen above is the daily chart of Nifty and, as can be seen, the Nifty has now reached the bottom end of the range at 4200. It is expected to find support at these levels, unless it proves otherwise. In the bottom half of the chart is the Relative Strength Index (RSI) and that shows that it has not yet reached 40 (it is at 42, to be precise). The price at the support level and the RSI still above 40 may indicate that the support maybe respected by the markets. In case they don’t and 4200 is broken decisively on the charts then we may be staring at 3800 in the face.

Since we know that we are at the support level, this may be a good time to buy Nifty futures or Nifty calls. If the markets were to break 4200 then we shall close our long positions with a small loss. For the record, Nifty 4200 calls are trading at Rs.138/- while 4300 calls closed ar Rs.90/- per Nifty. The lot size happens to be 50 Nifties.


Update: The Rupee to Dollar exchange rate has moved up to Rs.46 to a dollar. Last time the dollar touched 46 was on Sep 29, 2006. Asian markets have opened and are trading weak with losses between 2 and 4 percent. Nifty in the Singapore market is 155 points down at 4070. Expect Nifty here too to break 4200. Do not take any long positions.

Please do subscribe to my posts, so that all posts are delivered free to your inbox and you don't miss any useful analysis of the markets in the future.

Happy Investing!!!

Friday, September 12, 2008

Double Top Formation in Nifty, Target 4160

The Nifty, contrary to our prediction yesterday, went down today. The short term signs of bullishness were cancelled the moment Nifty opened below our stop loss of 4380. The Nifty continued to move down throughout the day and finally ended the day with a massive 110 point loss while the BSE Sensex lost 338 points in the day. The European markets closed roughly a percent and a half down while American markets at the time of writing were, more or less, flat with a slight negative bias. Crude continued to move down and bounced back from $100 today and is currently trading at $101.60 to a barrel.

Nifty 30 Minutes Chart - Double Top Formation Confirmed

The 30 minutes chart of the Nifty, shown above, shows that not only were the signs of bullishness cancelled on opening (as shown by the green arrow) but the next hour also confirmed a double top formation, which is also known as a ‘M’ formation or an inverted ‘W’ formation. This pattern has been marked on the chart with thick green lines. This double top pattern has its neckline at 4340 and the top at 4520, which means it could have a target 180 points below 4340 which converts to a target of 4160 on the charts. Also shown on the chart is the Moving Averages Convergence Divergence (MACD), which had given a sell signal on the afternoon of 8th Sep 2008, is still maintaining a sell. The stochastics oscillator (shown in yesterday’s chart), which had given a buy signal yesterday continues to maintain a buy position.

On the daily charts, as mentioned in previous posts, the Nifty is moving within a range of 4200-4650. A breakout out of this range should give us a tradeable move in the intermediate term. But will the prices break out of this range this time? Well, we can’t say at the moment because the markets have a mind of their own and will do what they want to do. But the principles of technical analysis tell us that we should follow a trend and that a trend is thought to be ‘innocent’ till it is proved ‘guilty’. In this case, the trend is that the price finds support at 4200. So, we shall assume that prices will find support again near 4200. But Vikas, you just said that the Nifty is now bearish and has a target of 4160. Well, yes, I did say that. The short term charts tell us that the Nifty should, rather may, come down to 4160 while the daily charts suggest that it will find support at 4200. Whenever there is such a situation, we shall follow what the longer term charts say. It is also possible that the Nifty may go below 4200 on an intraday basis and yet close above it. Or that it may go down to 4160 on one day and come back into the range on the next day. While we shall assume the Nifty to find support at 4200 but what the market actually wants to do will be known after the event. We shall change our strategy, if the need be, once the market decides to move against us. For now, it is support at 4200.

Please do
subscribe to my posts, so that all posts are delivered free to your inbox and you don't miss any useful analysis of the markets in the future.

Happy Investing!!!

Thursday, September 11, 2008

Nifty Displays Short Term Bullishness

I feel great pleasure in informing you, my readers, that today happens to be my 200th post on this blog. What Brian Lara has done 9 times, Don Bradman 12 times, Rahul Dravid 5 times, Sachin Tendulkar and Sunil Gavaskar 4 times each (a score of 200 and above), I have done once :-). It's nice to be in this elite club of 200 and above.

The Nifty opened with a downward gap of about 50 points consequent to bad American and Asian markets. After some initial hitches and an hour of range bound trading, it staged a good recovery to fill the gap with which it had opened but at 12:30pm it started the southward journey once again and this time it was a consistent fall. A little bit of recovery in the last 30 minutes made the Nifty end the day with a loss of 68 points and the BSE Sensex closed 238 points in the red. In the international scene, as the things stand now (at the time of writing), crude, after making a low at $101.50, is now trading close to $102.50, FTSE closed about 50 points down, while Dow Jones is about 90 points in the green after a loss of 280 points yesterday.


Nifty 30 Minutes - Stochastics Gives Buy Signal

Seen above is the 30 minutes chart of the Nifty. Along with the prices, at the bottom is shown the stochastics oscillator. As can be seen from the chart, the Nifty opened the day with a huge upward gap on 8th Sep 2008. This gap up opening was fully closed/filled today and it was then that the recovery came about in the last 30 minutes. Also shown on the chart is a small trading range within which the prices are moving for the last six days. This range is between 4340 and 4520. A move outside this range will give us a tradeable move in the short term. A trendline in black color has also been drawn on the chart connecting the pivot lows formed from 28th of last month till date. If one looks at the stochastics oscillator, one can see that a buy signal was given today in the last 30 minutes when the %K line (red) crossed the %D line (black) upwards, which is again a short term bullish sign. So, it makes sense to buy Nifty or Nifty calls for the short term with a stop loss of 4380.

Please do
subscribe to my posts, so that all posts are delivered free to your inbox and you don't miss any useful analysis of the markets in the future.

Happy Investing!!!
Wednesday, September 10, 2008

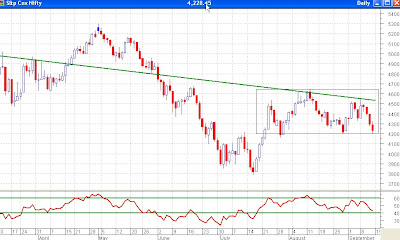
Nifty Forms Smaller Range Between 4350-4520

Hi readers, I had gone for a meeting today in Noida and came back home around midnight, so won't have much time to write the analysis. However, am sharing with you whatever little analysis I have managed to do today. Nifty opened weak today but then recovered during the day, even managed to cross yesterday's close but by closing time had dropped again to close in the red, thus forming a doji.

Nifty Daily Chart - Stochastics Showing Sell Signal

Attached above is the daily chart of the Nifty along with the trendlines and trend channel as shown in yesterday's chart. A new addition today is the stochastics oscillator at the bottom of the chart. As seen by the stochastics, it has given a sell signal 3-4 days back and is continuing to show that a short position should be maintained. The MACD (not shown on the chart), on the other hand, still hovers around the signal line and is generating whipsaws. Whipsaws are natural when the markets themselves are confused. Dojis and trading ranges are signs of confusion and decision. As has been mentioned in the past few newsletters, a tradeable move would come only if the Nifty were to go above or below the 4200-4650 range. Looking closely at the prices, one can find that a smaller trading range between 4350 and 4520 has formed in the last five days. Short term traders may like to trade a range breakout from 4350-4520, depending on which side it breaks out on. As can be seen by the trendline, the Nifty has yet again failed to cross this resistance line. This is proving to be quite a resistance.

Please do
subscribe to my posts, so that all posts are delivered free to your inbox and you don't miss any useful analysis of the markets in the future.

Happy Investing!!!

Monday, September 8, 2008

Markets Jump as Freddie and Fannie Bailed Out

The Nifty today, as was expected, opened about 150 points in the green after the NSG approved the nuclear deal in India’s favour. There was also the news from America that the Government had taken over mortgage lenders Fannie Mae and Freddie Mac, which had issued debt worth $1.4 trillion, and the bailout of which would require about $200 billion. Both were good news from the market’s point of view which is why it opened in the green today. At the time of writing this newsletter the Dow Jones is up almost 200 points, but has come off its highs. The same thing happened with the Indian markets earlier in the day. After a very good opening, the prices did sustain most of the day but started coming off in the final hour of the day. The day remained good enough for the Nifty to close 130 points in the green while the BSE Sensex ended the day with a gain of 461 points.

Nifty Daily Chart - MACD Slightly Bullish

Attached above is the daily chart of the Nifty. It is similar to the chart shown yesterday except that the ADX indicator has been removed and the MACD has now been shifted to the bottom portion of the chart. Looking at the price today in correlation to the resistance line CD, we notice that the price did go above the resistance line intraday but lost enough to close below it. The ADX indicator, though not shown in the chart today, still remains unchanged at 11 and the Nifty continues to be rangebound between 4200 and 4650, as marked by the black rectangle. As regards the MACD, the MACD line still stays close to the signal line, though slightly above it while both the lines are just above the equilibrium line of 0. While the Relative Strength Index (RSI, which again is not shown here) remains neutral the MACD is giving slightly bullish signs.

News from the crude front too remains positive. After rising to above $109 levels intraday it has now slipped back to $105.50. A negative crude should be good for the global equity markets.

Please do
subscribe to my posts, so that all posts are delivered free to your inbox and you don't miss any useful analysis of the markets in the future.

Happy Investing!!!

Sunday, September 7, 2008

Trending Move May Come Soon Enough

The Times of India newspaper on Sunday came out with a very interesting headline which read “India N-abled” With the NSG giving their decision in favour of India, the 34 year long period of ‘nuclear apartheid’ has ended for India. The report also said that India now has the unique status of being the only nuclear weapons power to be allowed global nuclear commerce without signing either the Nuclear Non-proliferation Treaty (NPT) or Comprehensive Test Ban Treaty (CTBT), which until now was a precondition for entering the elite nuclear club.

Ex-president and a prominent nuclear scientist, Mr. APJ Abdul Kalam says that the NSG waiver is good for India and that the country can choose to break the ‘voluntary moratorium’ on further tests in ‘supreme national interest’. He does not talk about the implications, though. Maybe, that would lead to another few decades of nuclear apartheid, but come to think of it, if that does happen we would not be any worse than what we already are. So, this NSG waiver is in the ultimate national interest of the country. This should be good news for the markets and we may see them go up on Monday, which may, eventually, take us outside the upper end of the range at 4650. According to Mr. Sudarshan Sukhani, the reality is that the deal itself is just a small help to the massive task of uplifting Indian poor to a better standard of living and that it is likely to play an insignificant part in the removal of poverty. Yet, he feels that the reality to be realized by the markets could take long enough to give us time to break out of 4600-4650 zone and reach 5100-5200 levels.

Nifty Daily Chart - MACD, ADX and Resistances

Seen above is the daily chart of the Nifty. I have added a lot of tools to the chart today and I hope it does not become very confusing for my readers. Superimposed on the prices, in brown, is the Moving Averages Convergence Divergence (MACD) which shows that it is now close to its signal line and has still not decided whether to go above these levels or to come below those. Hopefully, we should have an answer in a day or two, though the positive news already seems to have given the answer. Second, I have marked the recent range within which the Nifty seems to be moving, i.e. between 4200-4650. As is obvious from the range, there is support at 4200 and resistance at 4650. We can get a tradeable move in the intermediate trend only if the market were to come out of this range, upwards or downwards. Third, I have drawn a downtrending line marked AB which will provide resistance to the prices if it does decide to break above the upper end of the range at 4650. Fourth, I have drawn a line parallel to AB and have marked it as CD. This line, as can be seen, has been providing support/resistance at various levels in the last eight months. Surprising how just a line parallel to a trendline can do that. The most recent resistance was provided at 4515 on Thursday. Will it provide resistance again tomorrow or will this line be crossed and then become the support, is yet to be seen. In the bottom part of the chart I have attached the ADX indicator which, as mentioned in earlier newsletters, reflects the speed of a trend and extreme levels, such as those below 15, represent that one particular trend may now pick up momentum and the markets could follow that trend. However, it fails to give the direction of the trend and other indicators have to be seen to ascertain which way the trend is likely to shape up. The simplest way to find that out is to see which side of the trading range the Nifty breaks out on. The ADX value for the Nifty on Friday was 11 and never has the ADX reached such extreme levels, at least not in the last two years. We should soon see a big trending move come about.

Please do
subscribe to my posts, so that all posts are delivered free to your inbox and you don't miss any useful analysis of the markets in the future.

Happy Investing!!!

Thursday, September 4, 2008

Messed Up With The Template

How stupid of me! I messed up with the default template today and now the page is not loading on my computer. I wonder if it is opening on yours. If you can read this, please bear with me. I'll redo the whole thing on the weekend. Probably should be up and running by Monday. If I am unable to duplicate the same template again, there may be some changes on the site. Sorry for all the trouble.

Wednesday, September 3, 2008

Nuke Deal on Tenterhooks

The Nifty on Monday suddenly started rising at around noon time when the crude oil, which had been respecting the $110 support level for quite some time, came to $107 levels. The break of this important support level for crude meant that more downside could be seen in crude. And what is negative for crude turns out to be good for the equity markets. This sent the Indian equity markets skyrocketing and the Nifty, for the last hour and a half, remained above 4500 to finally close at 4504, a gain of 155 points.

News from the crude front still remains good as it continues to trade in the vicinity of $108 today. But the news from the world over has turned negative. Today was a holiday in the Indian markets on account of Ganesh Chaturthi and while the Indian traders were enjoying a quiet holiday here, the traders in Asia and Europe were busy selling. All Asian markets, with the exception of Nikkei, closed between a percent and two percent down. The European markets met with the same fate today when they opened. The US markets, surprisingly, were only half a percent down today.

Suddenly, once again, the nuke deal seems to be of the prime importance for the time being. According to a
letter written on January 16 earlier this year by Late Mr. Tom Lantos, the then Chairman of the House Foreign Affairs Committee, which was made public by the current Chairman Howard Berman, the US has the right to stop nuclear fuel supply to India altogether should it conduct another nuclear test. And all the time the Manmohan Singh government has been claiming that the deal in any way would not prevent India from conducting any more nuclear tests. As per the US Ambassador David C Mulford, there is nothing new in the letter made public today and that New Delhi was kept in the loop all the time. And the UPA government sources say that they are aware of the current US policy. Now, what does that mean? That in spite of knowing about these restrictions, the government was going ahead with the deal, thus jeopardizing the country’s national security, and all the while keeping the opposition and the Indian public in the dark? And worst of all, the US State Department had asked the US Congress to keep the letter a secret because the information was so ‘sensitive’ that it could have toppled the Manmohan Singh government.

I am sure the Indian public has some questions to ask the UPA government. Was the deal so important that they could goahead with it in spite of knowing that their hands would be tied when it came to the security of the country? If it was, then why was the government making repeated assurances that their hands would not be tied? And if it knew about these restrictions, why was the public and the opposition kept in dark about this? Does it not feel ashamed now that the findings have become public? Please, readers, I need some comments from you. Am I wrong in asking these questions? Would you not ask the same questions? Or would you agree with what the government has done? Are there any American readers here? What do you, the people of America, feel about the India US Nuke Deal?

With this news coming out today, I feel there is no way, if the government has any shame left, that the deal can be operationalised in the current form. And if it can not be operationalised and if all the Asian and European markets are down, there is no way the Indian markets can ignore all of this. So, the Indian markets are bound to come down tomorrow, unless something drastic happens overnight.

Nifty Daily Chart - RSI at 60. Resistance here?

Seen above is the daily chart of the Nifty and as can be seen, the Nifty is now heading towards the upper end of the range at 4650. As of now, the chances are quite bright that the markets would open with a negative gap tomorrow. Would that mean a return line failure, which means that the prices would fail to reach the upper end of the range? That would mean that the RSI would find resistance near 60, which means there is no strength in the markets. And that means no weakness either, because in trading ranges the RSI is expected to move between 40 and 60, or maybe 35 and 65. This implies that we are now again looking at a support near 4200. And a retest of that support after a return line failure could mean that the test may fail support may break.

Please do
subscribe to my posts, so that all posts are delivered free to your inbox and you don't miss any useful analysis of the markets in the future.

Happy Investing!!!

Under Virus Attack

My machine, being under heavy virus attack, is refusing to open any program (including internet explorer) which is why I couldn't post anything yesterday. Today also I am posting from another computer but without the benefit of any charts. As regards the markets, the Nifty continues to move between 4200 and 4650. While there is heavy resistance in the 4600-4650 zone, some mild resistance can also come at around 4500 levels. It was probably the $7 fall in crude today (which brought it below the $110 support level) which made the markets shoot.

More tomorrow. Or, when my computer is back to normal (which I hope will be tomorrow).

Please do
subscribe to my posts, so that all posts are delivered free to your inbox and you don't miss any useful analysis of the markets in the future.

Happy Investing!!!