Thursday, October 9, 2008

Break From Blogging

The market has started showing some signs of capitulation now. On Wednesday, the Nifty after recording a low of 3329, managed to improve and finally closed at 3513, almost 200 points above the day's low. This did not happen due to any positive news that came into the market. I personally feel that it happened because of the value buying that took place in stocks. If it really was value buying then we might have seen the end of the capitulation. If it was something else, and not value buying, then there may be more downside possible. For that let us understand first what capitulation is. Capitulation is when there is negative news, negative sentiment, negative outlook and all the negativity around and everybody is busy selling stocks to avoid further loss. This was happening since the last 2-3 days. By this time the market has fallen so much that people have lost confidence in the markets and then suddenly, out of nowhere, stocks are so cheap that value buying emerges and we see the end of the bear market. It is still too early to say whether the bear market has ended or not but it does seem that capitulation has already taken place or is taking place now.

Okay, a little bit about myself now. I am a technical analyst and enjoy predicting the markets by using technical analysis. I am also a stock broker and I wanted to share my ideas and analysis with my clients. To enable that I started blogging on 20th Novemeber 2007. Since then I have come a long way. I now have more readers across the world and on any given day they outnumber my clients three to one. Over the last 11 months, I have never taken a break from blogging, except an odd day here or an odd day there or when I wasn't well or when my computers was attacked by viruses, and I have been there for my readers all other days. I do think that I need some time off now. I'm not going for a holiday. I'm going to be here only but I just want a break from blogging. I have also got a lot of other jobs which have piled up over the months. How about giving me two weeks off? How about if I come back with my posts in the last week of October or the first week of November? Okay, let us keep 27th Oct as the tentative date of my return to the blogging world. Meanwhile, if you do have any questions/suggestions, do leave them in the comments section below or just send me an e-mail.

For those who are not subscribed to my posts and do not want to miss my posts on my return, please do
subscribe to my posts, so that all posts are delivered free to your inbox and you don't miss any useful analysis of the markets in the future.

Happy Investing!!!

Wednesday, October 8, 2008

Nifty Resistance At 3630, Support At 3540

Today’s movement in the Nifty was not totally unexpected. It was to be expected that the P-notes issue being eased and the CRR slash would lend a helping hand to the Nifty, which did happen because the Nifty opened with an upward gap of about 125 points. But the overall sentiment being negative, it was also to be expected that the market would eventually lose its way and come down, and that also did happen because at one point during the day the Nifty was down by as much as 50 points. But a final surge that lasted about an hour and a half took the Nifty back up to make it close with a gain of 4 points, thus making a doji for the day. (A doji, as explained in all previous newsletters, is a day where the opening price and the closing price is the same or is very close to each other. Such a candle has a non existent body but has a lower shadow and an upper shadow, the exception being gravestone dojis and dragonfly dojis where one of the shadows is also missing.) The BSE Sensex, not having the luxury of having 50 stocks in its composition and not having gainers like National Aluminium, Reliance Power, SAIL, Tata Communications and Zee Entertainment, closed about 106 points in the red.

World markets continue to be negative. Asian markets remained weak, European markets were, more or less, flat but the American and Latin American markets continue to trouble us. The Dow Jones, at the time of writing, was trading 290 points in the red while the Nasdaq Composite was almost 75 points down. Crude oil was trading at almost the same levels - $88 a barrel while the rupee versus the dollar is now touching almost 48. Gold continued to remain good – after a jump of $33 an ounce yesterday, it has gained another $24 today, obviously as demand for a safe haven increased and on speculation that the central banks may slash interest rates.

Nifty 30 minutes chart - Resistances Close By, MACD positive

Attached above is the 30 minutes chart of the Nifty. The daily chart is not shown here but it has already been mentioned that today’s candle was a doji. A doji, after a downtrend, represents indecision and confusion and indicates that there may be a short term increase in the prices. In the chart above there are two trendlines drawn. The steeper trendline, suggests a resistance near 3630 levels. If this level is crossed decisively, then we could see it go to the next resistance, as shown by the longer trendline, close to 3850. Since the trendline is sloping downwards, every new candle will keep bringing the resistance closer. Support comes near the brown line near 3540. A move below this level would not give us any support before 3130 levels. As suggested yesterday, that is the next support level but the market, being the supreme being that it is, may find a new support before 3130 wherever it chooses. Also shown on the chart is the Moving Average Convergence Divergence (MACD), which gave us a buy signal early in the morning today and continued to remain positive throughout the day.

Please do
subscribe to my posts, so that all posts are delivered free to your inbox and you don't miss any useful analysis of the markets in the future.

Happy Investing!!!

Tuesday, October 7, 2008

Global Meltdown 'Melts' Nifty

It’s the scenario of a global meltdown today. It’s like a ship, much bigger than Titanic, which is as big as the whole world, and it is going under. Everything seems to be sinking. Let’s have a quick look at the world markets. The Nifty closed with a loss of 215 points for the day while the BSE Sensex tanked 724 points. Asian markets were down quite a bit today (Monday) with the Japanese Nikkei shaving off 4.25%, Hang Seng 4.97%, Chinese markets losing 5.23%, Singapore Straits 5.6% and Jakarta leading the pack with a loss of 10.03%. The situation in the European markets was no better with the London FTSE losing 5.77%, German DAX losing 7.07% while the French CAC lost 9.04%. As far as America is concerned, at the time of writing, Dow Jones was trading 559 points in the red (5.41%), the Nasdaq was losing 139 points (7.13%) while the S&P500 had lost 71 points or 6.43%. On the commodities front, Crude was losing 4.92% today, copper 7.62%, most agricultural commodities losing 6-7% while Gold being the ‘safe haven’ for investors was up 4.13%.

As far as the technical analysis of our charts is concerned, there seems to be no hope for the Nifty, even though there was some good news for the Indian markets. The 40% cap enforced by SEBI in Oct 2007 on Assets Under Custody through Participatory Notes (P-Notes) has now been done away with. So, now there is no restriction on P-Notes. Moreover, the RBI has slashed the CRR by 50 basis points. Both these decisions have been taken with a view to increase increase liquidity in the markets. But one wonders how much will this help when the Nifty has broken the major support level of 3800 and is even below the next support of 3640.

Nifty Weekly Chart - New Head and Shoulders Pattern Formed

Seen above is the weekly chart of the Nifty showing the movement in the last two years. The portion of the chart from Mar 2007 to May 2008 has been marked with a bearish head and shoulders pattern with the neckline as shown by the green dashed line. The target for this head and shoulders pattern is 2600. It seems that the Nifty today has confirmed another, and larger, head and shoulders pattern formed between June 2007 and today. The neckline for this pattern has been shown as the solid green line. The target for this new pattern is half of the last pattern which roughly works out close to 1300 levels on the Nifty. Though, nothing is ever certain with the markets, I can say with reasonable certainty, and accuracy, that this target would not be achieved. And I sincerely hope, for the good of the nation and so many investors, that the markets do not prove me wrong here. Shown in the bottom portion of the chart is the Relative Strength Index (RSI), which continues on its way down and is not even showing a divergence, which might give us some glimmer of hope.

Some immediate support levels for the Nifty are at 3554 (minor), 3130 (reasonable) and 2600 (strong). The Nifty may go on to achieve one of these levels or can find support somewhere in between. Let us hope that this support level comes as soon as possible. But, if things do not change very soon, I’m afraid to say that we’re going to have a lousy Diwali.

Please do
subscribe to my posts, so that all posts are delivered free to your inbox and you don't miss any useful analysis of the markets in the future.

Happy Investing!!!
Sunday, October 5, 2008

Nifty Weak Below 3800

There is nothing much to say today. I had a look at a lot of charts today. I saw the 30 minutes chart of the Nifty, the 60 minutes chart of the Nifty, the daily charts, the weekly charts, the monthly charts, had a look at the charts of various stocks too,and yet after having seen all those, I am still at a loss for words. I honestly do not know what is going to happen tomorrow or in the coming days. All I know is that from the charts of the stocks that I had a look at, things aren't looking too rosy. That obviously does not mean that things are looking bad. I can't say whether things are bad or not but they are definitely not good.

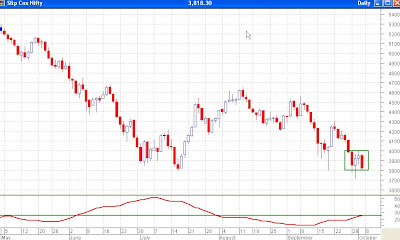
Nifty Daily Chart, ADX increasing, downtrend picking up momentum

As far as the Nifty goes, I have attached the daily chart of Nifty on top. There is not too much to discuss on this too except for the last four days. As marked by the green rectangle, the prices have been moving within a small range between 3800-4000. Four days is too short a time on the daily charts to term it as a range bound movement, yet the rules/fundamentals of rectangles or trend channels do apply here. i.e. the top of the range at 4000 should provide resistance whereas 3800 should provide support. In case 3800 is broken, there is some minor support available at previous lows at 3777 and 3715 but a major support is not seen till 3635. While an intraday movement of below 3800 can be expected, a close below 3800 will be bearish. The ADX indicator, which measures the speed of a trend has also reached 24 after attaining a low of 11 which indicates that the speed of the downfall/downtrend is picking up. It pays to be cautius.

Please do subscribe to my posts, so that all posts are delivered free to your inbox and you don't miss any useful analysis of the markets in the future.

Happy Investing!!!

Friday, October 3, 2008

Short Term Bullishness, Intermediate Term Bearishness

After the US bailout package was defeated in the House of Representatives on Sep 29 228-205, the Senate approved the same last night with a thumping majority 74-25, says Bloomberg. The package would be sent to the ‘House’ again Friday afternoon for reconsideration. Many republicans who voted against the package last time may reconsider and switch their votes in favour of the bailout package. Despite the Senate’s approval US stocks remain down today with the Dow Jones trading with a loss of 330 points. European markets also remained weak losing between 2 and 3%. Gold has lost a few dollars while crude has slipped to $94 a barrel. The only thing that remains strong in this kind of a market is the dollar, and who can forget our very own Nifty.

Nifty Daily Chart - Long Lower Shadows and Stochastics Bullish in Short Term

Seen above is the daily chart of Nifty. Just like it was seen a few days back, the Nifty again displayed long lower shadows on its candles, which happens to be a short term bullish sign. The 5,3 stochastics oscillator, too, slowed down by 3 days has given a buy signal. The Nifty seems all set for a short rise from here. Possible resistance levels for this short spurt seem to be near the two green trendlines drawn. For tomorrow, one of the resistances lies near 4043 and the other lies at 4075. The Nifty, on Wednesday, after touching a high of 4000.50 dropped and finally closed at 3950.75.

Well, the Nifty is displaying short term bullishness, as the charts suggests, but also, as is evident from the charts, we still happen to be in an intermediate term downtrend with the Nifty clearly showing a pattern of lower highs and lower lows since early August. Now, which of these trends will prevail in the short term is difficult to say. It could be a downtrend since there is bearishness all across the world. But that has been there since quite a few days now, yet our Nifty is displaying strength. The Nifty may decide to go up first, touch one of the trendlines, and then fall back. And finally, the Nifty may even decide to slip from where we currently are. What will be its final decision, will be seen tomorrow. Till then be careful at 4043, 4075 and 4100 on the upperside and 3800-3850 on the downside.

Please do
subscribe to my posts, so that all posts are delivered free to your inbox and you don't miss any useful analysis of the markets in the future.

Happy Investing!!!