The Nifty had a good day on Friday too. With a fabulous 200 point increase in Nifty on Wednesday and all its gains being washed away on Thursday, Friday turned out to be a good balm for the wounds of Nifty. A 90 point increase in the Nifty came at a good time but the move up was gradual and interrupted by regular corrections during the day. Inflation was a major worry and with inflation moving up to 11.63%, the market started coming down but not for long. The next move up took it past the earlier highs of the day but then it went into a 40 point range between 3980 and 4020.
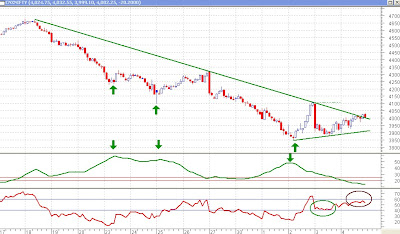
 Seen above is the 30 minutes chart of the Nifty along with the Directional Movement ADX indicator on top (green colour with red horizontal lines) and the Relative Strength Index (RSI) at the bottom (red colour with blue horizontal lines). The ADX indicator, as mentioned in yesterday’s post, measures the strength of a trend while the RSI measures the strength of a stock/index with respect to its historical prices. As seen from the chart, and as marked by the green arrows, every successive low in the Nifty saw a reduction in the strength of the trend, as measured by the ADX. Now the ADX is at a level of 15 and below 20 it does indicate that there is no trend in the market except sideways. This gives us an indication that the downtrend may have been over.
So, are we in an uptrend now? Not yet. As mentioned in a previous post, a short term uptrend shall be confirmed only if the Nifty were to go above 4105. We would get an early indication that the trend has changed if the Nifty were to go above the downward sloping trendline. The RSI finding support near 40, as marked by the green circle, also gave us positive indications about a forthcoming uptrend. Unfortunately, things change fast where the markets are concerned. With a 90 points increase in the markets, anybody would say that a short term uptrend will come about. However, the charts suggest differently. The move, as already mentioned, was slow and lacked momentum and, though the prices managed to cross the trendline, there was no excitement/large range candle associated with the breakout, which gives me doubts whether the breakout was genuine or not. The RSI finding resistance near 60, as marked by the brown circle, and failing to go above it also makes one wonder whether an uptrend will come now or after another brief correction.
At this moment, I’m afraid, this increase in prices may fizzle out once again. We may see another fallback to the lower trendline to 3920 or upto the previous lows below 3850 (or even lower??) before we make another attempt at a pullback. A move below 3875 will signify that we are back in a downtrend.
Please do subscribe to my posts, so that all posts are delivered free to your inbox and you don't miss any useful analysis of the markets in the future.
Happy Investing!!!
No comments:
Post a Comment