Today the Nifty opened on a stronger note but soon started falling and within minutes it was in the red and from thereon, it was a unidirectional fall for the Nifty, except in the last hour and a half when it made a strong recovery, but not enough to bring it in the green. In the process, just after opening it made a high of 5996, in the mid-afternoon it touched a low of 5917, recovered to 5951 and then ended the day 46 points in the red at 5939. Well, the Nifty made it clear today that it is going down and going down a long way. But the small recovery towards the end could be a signal that a small bounceback could come.
Showing posts with label Head and Shoulders. Show all posts
Showing posts with label Head and Shoulders. Show all posts
Tuesday, June 4, 2013
Sunday, April 7, 2013
Bearish Head and Shoulders Pattern in Nifty? Target 5200
Thursday's close was a bit too hard for the Nifty to cross on Friday. Thursday's close was 5574 while Friday's high was 5577 and while the Nifty made at least 4 attempts to cross it decisively, it couldn't. Those are the signs of a weak market, of a market gripped by bears. the low made by the Nifty was 5534 but finally it managed to close a bit higher at around 5553, which was still 21 points in the red as compared to Thursday's close. It seems that the Nifty is still on its way down and with a much bigger target. There may be minor supports in-between which have been discussed below with the help of the charts shown.


Monday, October 29, 2012
Maybe The Credit Policy Will be The Trigger
Another narrow range day for the Nifty today. Opened with a slight gap up, continued its way down most of the day but showed a smart recovery of about 20 points in the last hour of trading and closed slightly in the green - just 1 point up. As of now it is continuing to trade in the range of 5630 to 5725. The cabinet reshuffle had virtually no effect on the Nifty. Maybe RBI credit policy will act as a trigger for the breakout from the range. Let's see whether it does happen tomorrow or not. The market is expecting the rates to remain unchanged or at the most a 25 basis points cut in the CRR.
Tuesday, October 7, 2008
Global Meltdown 'Melts' Nifty
It’s the scenario of a global meltdown today. It’s like a ship, much bigger than Titanic, which is as big as the whole world, and it is going under. Everything seems to be sinking. Let’s have a quick look at the world markets. The Nifty closed with a loss of 215 points for the day while the BSE Sensex tanked 724 points. Asian markets were down quite a bit today (Monday) with the Japanese Nikkei shaving off 4.25%, Hang Seng 4.97%, Chinese markets losing 5.23%, Singapore Straits 5.6% and Jakarta leading the pack with a loss of 10.03%. The situation in the European markets was no better with the London FTSE losing 5.77%, German DAX losing 7.07% while the French CAC lost 9.04%. As far as America is concerned, at the time of writing, Dow Jones was trading 559 points in the red (5.41%), the Nasdaq was losing 139 points (7.13%) while the S&P500 had lost 71 points or 6.43%. On the commodities front, Crude was losing 4.92% today, copper 7.62%, most agricultural commodities losing 6-7% while Gold being the ‘safe haven’ for investors was up 4.13%.
As far as the technical analysis of our charts is concerned, there seems to be no hope for the Nifty, even though there was some good news for the Indian markets. The 40% cap enforced by SEBI in Oct 2007 on Assets Under Custody through Participatory Notes (P-Notes) has now been done away with. So, now there is no restriction on P-Notes. Moreover, the RBI has slashed the CRR by 50 basis points. Both these decisions have been taken with a view to increase increase liquidity in the markets. But one wonders how much will this help when the Nifty has broken the major support level of 3800 and is even below the next support of 3640.
As far as the technical analysis of our charts is concerned, there seems to be no hope for the Nifty, even though there was some good news for the Indian markets. The 40% cap enforced by SEBI in Oct 2007 on Assets Under Custody through Participatory Notes (P-Notes) has now been done away with. So, now there is no restriction on P-Notes. Moreover, the RBI has slashed the CRR by 50 basis points. Both these decisions have been taken with a view to increase increase liquidity in the markets. But one wonders how much will this help when the Nifty has broken the major support level of 3800 and is even below the next support of 3640.
 Seen above is the weekly chart of the Nifty showing the movement in the last two years. The portion of the chart from Mar 2007 to May 2008 has been marked with a bearish head and shoulders pattern with the neckline as shown by the green dashed line. The target for this head and shoulders pattern is 2600. It seems that the Nifty today has confirmed another, and larger, head and shoulders pattern formed between June 2007 and today. The neckline for this pattern has been shown as the solid green line. The target for this new pattern is half of the last pattern which roughly works out close to 1300 levels on the Nifty. Though, nothing is ever certain with the markets, I can say with reasonable certainty, and accuracy, that this target would not be achieved. And I sincerely hope, for the good of the nation and so many investors, that the markets do not prove me wrong here. Shown in the bottom portion of the chart is the Relative Strength Index (RSI), which continues on its way down and is not even showing a divergence, which might give us some glimmer of hope.
Some immediate support levels for the Nifty are at 3554 (minor), 3130 (reasonable) and 2600 (strong). The Nifty may go on to achieve one of these levels or can find support somewhere in between. Let us hope that this support level comes as soon as possible. But, if things do not change very soon, I’m afraid to say that we’re going to have a lousy Diwali.
Please do subscribe to my posts, so that all posts are delivered free to your inbox and you don't miss any useful analysis of the markets in the future.
Happy Investing!!!
Wednesday, September 24, 2008
Nifty Falls, Ignores Island Reversal Pattern
The Nifty opened weak today, as was expected, because of the weak American and Asian markets. The Dow Jones was down 372 points overnight while all Asian markets, except Nikkei, were trading in the red with Hang Seng leading the pack, which finally closed with a loss of 759 points, down 3.87%. Followed by a weak opening, the Nifty did try to recover but the happiness lasting only about an hour or so, after which the index started its decline. Another attempt at recovery came shortly after noon but that too didn’t last long and from there it was a steady decline for the Nifty through the day. The island reversal pattern seen on the Nifty two days back was completely ignored today.
 Seen above is the tick by tick chart of the Nifty. As seen from the chart, the Nifty, early in the morning, after going to 4150 started going up, made a top near 4190, and came down to 4171.35. Then a small recovery took it past its highs of the day, went up to 4224.60 came down to 4171.35 again, climbed to 4203.30 and finally broke through 4171.35, thus completing a bearish head and shoulders pattern. With the top of the head at 4224.60 and the neckline at 4171.35, the target was 53.25 points (4224.60-4171.35) below 4171.35. This gave us a target level of 4118.10 (4171.35-53.25) on the Nifty. So, we saw a bearish head and shoulders pattern being formed, being confirmed and the target achieved, all in one day. And we can see that after this head and shoulders pattern target was achieved, there was an immediate bounce in the price from that level. This case was more like a case of a perfect head and shoulders pattern. In most cases, either the neckline is not straight, or the shoulders are not perfect or the target is not achieved or the price overshoots the target. But then, life is never perfect. One has to live it the way it is offered to us and make the best of it.
Well, that was the intra day chart for today only, but what is the forecast for tomorrow or the days after that? To try and forecast what the market would do is like trying and forecasting whether the next toss of a coin would be a heads or a tail. The market remains as unpredictable as ever and most of the times move against our wishes/forecast. But we also know that when it does move in our favour, most of the times we get a move big enough to wipe off most of our losses. That is where technical analysis comes in handy, where 7 trades out of 10 turn out to be loss making trades, but the remaining three trades are big enough to wipe the 7 losses and giving us a net profit. Technical Analysis only helps us increase the probability of making a profit. One of my previous posts title “The Probability of Profitability” very well explains this. Well, and to do that we have to analyse to see what our analysis says.
 Attached above is the 30 minutes chart of the Nifty, which gives us a slightly longer term view than what the intra day chart gives us. Notice that in this chart, the bearish head and shoulders pattern, which was so clear in the tick by tick chart, is not visible here. Last week we had seen the Nifty slip into a narrow range between 3950 and 4100. This range has been marked by a trend channel/rectangle. Notice that the upper end of the rectangle lies somewhere between 4090 and 4100 and not exactly 4100. Also shown in this chart is the Moving Averages Convergence Divergence (MACD) and the upper line of the rectangle extended till date. This extended line tells us that there is support available between 4090 and 4100. The MACD, which had given a sell signal yesterday, reaffirmed it today by going below the equilibrium line at 0. Notice that there is a blue coloured trendline here too which shows that there maybe support available for the MACD at current levels, which, if broken, would have bearish implications. There are also Fibonacci retracement levels drawn on the chart for the two day rise from 3800 to 4300. These Fibonacci levels tell us that the 38.2% level is still intact may (or may not) provide support at 4112. If this is breached, the next Fibonacci levels of support are at 4050 and 3995, being the 50% and the 61.8% retracement levels, respectively. For now, we can just wait and watch, which of these levels does the Nifty feel worthy enough to respect.
As far as the international markets are concerned, the London FTSE and French CAC closed with a loss of about 2% while the German DAX lost 1% of its value. American markets are more or less flat at the moment while the crude has come off its yesterday's highs and was today in the vicinity of $106 a barrel.
Please do subscribe to my posts, so that all posts are delivered free to your inbox and you don't miss any useful analysis of the markets in the future.
Happy Investing!!!
Wednesday, September 17, 2008
Head and Shoulders Confirmed, Pullback to 4200 Possible
First of all I would like to apologise to my readers for not being able to post my comments on the markets yesterday. Though, I love writing and sharing my technical views with my readers, but there are days when I have meetings with clients in the evening and sometimes over dinner and those days it becomes difficult for me to post my views. Anyways, I am back today.
Saturday evening, Delhi was rocked by serial bomb blasts. By opening on Monday morning there was news that Lehman Brothers had filed for bankruptcy and that Merrill Lynch was being sold out to Bank of America. The US government confirmed today that Lehman Brothers would not be bailed out. Insurance giant, American International Group (AIG), has asked the Fed for a loan of $40 billion and it is uncertain as yet whether it would help or not. With such news floating around in the market, the markets were bound to go down and the trading range between 4200-4650 was finally broken, but on the downside.
As of today, the London FTSE closed 120 points down losing 2.3%, the German DAX lost 1.12% while the French CAC was virtually unaffected losing only 0.81%. The Asian markets were much worse today (Tuesday) with the Hong Kong Hang Seng losing 5.44%, the Japanese Nikkei 4.95%, the Shanghai index 4.47% and the Korean Kospi losing 4.6%. Compared to them, the feat which the Nifty accomplished was mind boggling. After losing more than 153 points at one point during the day, the Nifty still managed to close in the green, albeit only 2 points.
Saturday evening, Delhi was rocked by serial bomb blasts. By opening on Monday morning there was news that Lehman Brothers had filed for bankruptcy and that Merrill Lynch was being sold out to Bank of America. The US government confirmed today that Lehman Brothers would not be bailed out. Insurance giant, American International Group (AIG), has asked the Fed for a loan of $40 billion and it is uncertain as yet whether it would help or not. With such news floating around in the market, the markets were bound to go down and the trading range between 4200-4650 was finally broken, but on the downside.
As of today, the London FTSE closed 120 points down losing 2.3%, the German DAX lost 1.12% while the French CAC was virtually unaffected losing only 0.81%. The Asian markets were much worse today (Tuesday) with the Hong Kong Hang Seng losing 5.44%, the Japanese Nikkei 4.95%, the Shanghai index 4.47% and the Korean Kospi losing 4.6%. Compared to them, the feat which the Nifty accomplished was mind boggling. After losing more than 153 points at one point during the day, the Nifty still managed to close in the green, albeit only 2 points.
 Attached above is the daily chart of Nifty with the Relative Strength Index (RSI) at the bottom. As seen from the chart, the Nifty has displayed a large head and shoulders pattern formed over a period of almost two months. This bearish head and shoulders pattern gives us a target of 3800 on the charts and it is quite possible that we may achieve that. Looking at the candles formed over the last two days. Both these candles have long lower shadows and today’s candle was a doji with a very long lower shadow. This should be bullish for the market in the short term. And, technically too, in all patterns which witness a breakout, on a number of occasions there are pullbacks. In this head and shoulders breakout too, we may see a pullback which means that the prices may retrace back to 4200 or nearabouts before continuing on their way to 3800.
A few days back I received, on my blog, a comment from Krishnamurthy, who said that he is short in Nifty since 4500 levels because he believed that Nifty had completed the 2nd wave zig zag and that had started the 3rd wave down. Krishnamurthy once sent me an e-book on Elliott Waves and gave me a couple of helpful tips. While I am a novice in Elliott Waves, Krishnamurthy has done a lot of research on it. Krishna, if you are reading this may I please invite you to contribute on my blog from time to time so that not only me, but all my readers too may benefit from your analysis. Please send in your articles to me by e-mail and I’ll post them on to the blog.
Please do subscribe to my posts, so that all posts are delivered free to your inbox and you don't miss any useful analysis of the markets in the future.
Happy Investing!!!
Tuesday, August 5, 2008
Nifty Displays Bullish Head and Shoulders Pattern.
The Nifty opened flat in the morning today and kept trading within a narrow range and was repeatedly finding resistance near 4420 and it wasn’t until 1PM, after the European markets opened, that it started rising again. The European markets closed very well in the day today with gains over 2 and a half percent since yesterday’s close. Even the Dow Jones right now is trading more than 200 points up in the green. Looking at the crude, after touching lows near $118, it is currently trading at $119.50. 118.20 to 118.50 seems to have provided good support to the prices today.
 Attached above is the daily chart of Nifty, along with a few trendlines drawn in and the Relative Strength Index (RSI). Let us start with the longest trendline in the chart which has been drawn from the beginning of May till date and which has been shown as a dotted trendline. This trendline was quite comfortably passed through during the day today. A second trendline, which happens to be shown as a solid line green in colour, has been drawn from the beginning of June till date. This also happens to be the neckline of the inverted head and shoulders pattern, which has been marked as S, H and S. A vertical line AB has been drawn from the neckline to the bottom of the head formation. This line has then been superimposed at the point of breakout (??) today. This superimposed line AB gives us a head and shoulders breakout target of 5200. It is not clear whether the head and shoulders pattern has been broken through or not yet. I feel it just fell short of confirming it. We would assume that this pattern has been confirmed if the previous pivot high at 4540 is surpassed, which happens to be another 40 points away. If that does happen the RSI also would cross 60, which would have happened in Nifty the first time in three months and only the second time since January, when the downfall started.
Is there anything that could go wrong? Yes, if it happens to be your bad day, everything could go wrong. Looking at the chart, we can see that the head and shoulders pattern has not been decisively confirmed today, which means that it could very well start coming down from here. Looking at the RSI too, we can see that the resistance at 60 has not been crossed as yet. If the Nifty turns down from here, 60 would not be crossed and it would be bearish for the index. If, on the other hand, the RSI crosses 60, we should be looking at further gains. On the downside, a move below 4140 would cancel this bullish head and shoulders pattern.
Please do subscribe to my posts, so that all posts are delivered free to your inbox and you don't miss any useful analysis of the markets in the future.
Happy Investing!!!
Tuesday, July 22, 2008
Government Wins Vote, Loses Credibility
The Government today won the trust vote. Big deal! They managed to win the trust vote by 19 votes. 275 votes were cast in favor of the government, 256 against and 10 abstentions. While stability in the government was retained, our 'honorable' Members of Parliament made a mockery of themselves and the voting process on live television. Talks of MPs being ‘bought’ were now made public with three MPs claiming to have been bribed to abstain from the vote. The charges, whether true or not, have made us realize what all actually happens in politics (as if we didn't already know). The government, for sure, has won the vote, but lost its credibility, in the eyes of the ‘aam aadmi’ (common man).
The Nifty went up today too making it four consecutive days of ‘decent gains’ in a bear market. The Nifty opened flat in the morning but after news of Omar Abdullah’s National Conference (having 2 MPs) decision to support the UPA government came, the market started going up, solely because the support of those two MPs would have seen the government through the trust vote successfully. Since then the markets have been up only (except a small pullback to 4200) and managed to close on a high too. 80 points above yesterday’s close and 40 points above the top of the range which was at 4200.
The Nifty went up today too making it four consecutive days of ‘decent gains’ in a bear market. The Nifty opened flat in the morning but after news of Omar Abdullah’s National Conference (having 2 MPs) decision to support the UPA government came, the market started going up, solely because the support of those two MPs would have seen the government through the trust vote successfully. Since then the markets have been up only (except a small pullback to 4200) and managed to close on a high too. 80 points above yesterday’s close and 40 points above the top of the range which was at 4200.
 Seen above is the tick by tick chart of the Nifty for today from 12:30pm onwards, which was taken from the NSE website. Clearly seen is a bullish head and shoulders pattern formed in the Nifty which has been marked on the chart. The pattern has already been confirmed and gives us a target of 4300 on the Nifty which happens to be 60 points away. Hopefully, that target should easily be achieved on opening tomorrow.
 Attached above is the daily chart of Nifty which shows the kind of rally we have seen in the last four days. It has now risen more than 11% in the last four days, has crossed the downward sloping trendline on the daily charts, has moved out of the range and now has managed to close above its most recent pivot high of 4215. Is this a bear market rally or the beginning of a new bull market? Well, it certainly looks like a new bull market but I wouldn’t advise my readers to be too sure about it. My reasons are that new bull markets are born on pessimism and the new bull market rallies would never be as sharp as the one we have just seen. Secondly, a very common phrase in the stock markets is to buy on rumours and sell on news. We have seen the market moving up on hope that the government would win the trust vote. Now that is public knowledge and the smart investor may now be looking to book his profits rather than building a position. Thirdly, a true confirmation of a bull market is when the market is making higher highs and higher lows. As yet, we have just seen a higher high but not a higher low. A correct strategy would be to wait for a pullback and then a rally for two days to see where the new pivot low is formed. If the low formed is above the previous low of 3790 then it may mean that a bull market has started but if the pullback goes lower than 3790 then there may be more pain left.
Please do subscribe to my posts, so that all posts are delivered free to your inbox and you don't miss any useful analysis of the markets in the future.
Happy Investing!!!
Tuesday, July 1, 2008
Capitulation Like Symptoms Visible
The Nifty yet again opened around the same levels as yesterday’s closing and started moving up. Yet again, at 11AM, it started coming down, and exactly like yesterday found support in the late afternoon session. But today the support was found 160 points below yesterday’s close of 4040 at 3878. The Nifty finally ended the day 144 points down at 3896. Our level of 3882 mentioned in yesterday’s post held very well today.
In the last few days I have been discussing Elliott Wave Counts on the Nifty and so far the counts appeared to be correct and working as per our expectations. To read what we had written in other posts discussing Elliott waves, one can go to the end of this post and under the section “Other Posts That May Interest You” read the posts listed under ‘Elliott Waves’. Or, simply click here to read all posts which have discussed Elliott Waves. Briefly, I had mentioned that we are, probably, in the 5th wave down of major corrective wave C. While writing yesterday’s post I got confused and had mentioned that wave 5 cannot be longer than 797.60 points which was the length of the 3rd wave down in the corrective wave C. As per the Elliott Wave principles, the 3rd wave is usually the longest but NEVER the shortest. And I got confused into thinking that if the length of the 5th wave is more than 797.60 then the 3rd wave would become the shortest. What I forgot was that even if wave 5 was longer than that, wave 1 would still be the shortest which measured only 385.05 points. And Sanjay rightly pointed out in the comments here that even if wave 5 exceeded 797.60 points, wave 3 would still not be the shortest. Thank you, Sanjay. Usually, if the 3rd wave is the longest, wave 5 is almost equal to wave 1. In some cases, it could even be 1.618 times, 2.618 times or 4.236 times of wave 1 (and in some of these cases wave 5 could then become the longest). This seems to be a case where wave 5 will be the longest. 1.618 times of 385.05 would be 623 points and the 5th wave is already longer than that. The next target for the end of wave 5 would be 2.618 times of wave 1 (385.05 points) which is 1008.05 points which works out to a target of 3671.70. God save us if it extends to 4.236 times of the first wave!
In the last few days I have been discussing Elliott Wave Counts on the Nifty and so far the counts appeared to be correct and working as per our expectations. To read what we had written in other posts discussing Elliott waves, one can go to the end of this post and under the section “Other Posts That May Interest You” read the posts listed under ‘Elliott Waves’. Or, simply click here to read all posts which have discussed Elliott Waves. Briefly, I had mentioned that we are, probably, in the 5th wave down of major corrective wave C. While writing yesterday’s post I got confused and had mentioned that wave 5 cannot be longer than 797.60 points which was the length of the 3rd wave down in the corrective wave C. As per the Elliott Wave principles, the 3rd wave is usually the longest but NEVER the shortest. And I got confused into thinking that if the length of the 5th wave is more than 797.60 then the 3rd wave would become the shortest. What I forgot was that even if wave 5 was longer than that, wave 1 would still be the shortest which measured only 385.05 points. And Sanjay rightly pointed out in the comments here that even if wave 5 exceeded 797.60 points, wave 3 would still not be the shortest. Thank you, Sanjay. Usually, if the 3rd wave is the longest, wave 5 is almost equal to wave 1. In some cases, it could even be 1.618 times, 2.618 times or 4.236 times of wave 1 (and in some of these cases wave 5 could then become the longest). This seems to be a case where wave 5 will be the longest. 1.618 times of 385.05 would be 623 points and the 5th wave is already longer than that. The next target for the end of wave 5 would be 2.618 times of wave 1 (385.05 points) which is 1008.05 points which works out to a target of 3671.70. God save us if it extends to 4.236 times of the first wave!
 I have the daily chart of Nifty uploaded today, as seen above. This chart is the same as yesterday, except being updated with today’s candle. As can be seen from the Bollinger Bands, today’s close was outside the limit of the lower band and this means that the downtrend would continue. Our analysis of the Elliott Wave Counts already suggests that we are looking at a target close to 3672. A quick run through the charts of various large caps and mid caps tells me that almost all stocks, with the exception of those in the pharma and IT sector, seem to have broken through their major supports on the downside. A little bit of capitulation like symptoms were visible today with the prices falling drastically with high volumes. However, there were rumours that an American hedge fund was selling and that the retail investors were not capitulating.
Udayan Mukherjee, the senior stocks analyst for CNBC TV18 said today, that the holdings of the retail segment are mostly in the mid cap and small cap segment and only a small quantity of the retail investors would be invested in the large caps. So, if at all a capitulation by the retail investors were to be seen, it would be mostly in the mid cap and small cap segment and very little in the large cap segment. I, somehow, tend to agree with him. I took a look at the chart of the CNX Midcap 200 Index also today and the picture looks grim, to say the least.
 Attached above is the chart of the CNX Midcap 200 Index. The Midcap Index fell by 426 points today, or 7.8% to close at 4992. A look at the chart above tells us that the Midcap Index has confirmed a bearish head and shoulders pattern below 5850, which was formed over a period of 12-14 months. The target for this pattern is close to 1700. If this Index does fall to 1700, it would have fallen 82.6% from its all time high. Incidentally, a smaller bearish head and shoulders pattern is visible on the Relative Strength Index (RSI) chart too. A fall of 82% would really be called capitulation. Please do not interpret my words to say that the midcap Index will fall to 1700. What I said was that it has a target of 1700. The market/this index may capitulate much before it reaches that level.
One very important thing to be noticed and kept in mind is the sentiment indicator. All analysts on TV, Radio and the newspapers are now extremely bearish about the markets. More and more analysts have started giving targets below 10000 on the Sensex. The media (both visual and print), besides business newspapers and business news channels, have started reporting about the massive fall in the markets and the amount of money that the investors have lost. Even knowledgeable people like mutual fund managers and FIIs have turned negative and have started selling. There is pessimism all around. All these factors indicate that we are somewhere very close to a bottom. Long term investments could now be made in small quantities (I’m not saying this as a technical analyst but only as a contrarion investor). Maybe this should cheer some of you out there in all this pessimism.
Please do subscribe to my posts, so that all posts are delivered free to your inbox and you don't miss any useful analysis of the markets in the future.
Happy Investing!!!
Thursday, June 26, 2008
Birth of a New Bull Market?
The resignation didn’t come today. Maybe it will come a few days later. Speculation is ripe that in a week’s time the UPA will meet the Left and inform them (rather than reaching a decision) that they are going to the IAEA (International Atomic Energy Agency) to get an approval on the safeguards text. The Left has categorically stated that it ‘will not allow them to go to the IAEA’. And the moment the Government goes, support would be withdrawn. The Government may not be able to garner enough votes to save itself in the event of a no-confidence motion.
 I have pasted above the 30 minutes chart of the Nifty. Formed over the last four days can be seen a small bullish head and shoulders formation on the Nifty. This pattern has been confirmed in the last 30 minutes. I, probably, would have expected a larger range candle in the last 30 minutes to accompany a breakout, but with profit booking possible in the last 30 minutes, a concession could be given. The target for this head and shoulders pattern is near 4430. While we are now in a short term uptrend, to confirm an intermediate term uptrend we need the Nifty to go above 4500. While head and shoulders are more reliable on daily and 60 minutes charts, they are not very trustworthy on 30 minutes/real-time and weekly/monthly charts. Had this pattern been visible on a 60 minutes chart, I would have been more convinced but it is not visible there. Another problem that I see with the pattern is that the Relative Strength Index (RSI) is finding constant resistance at 60, as marked by the circle. Its inability to go into the bullish zone may not be a very bullish sign. But we are in a short term uptrend and with the resignation not expected in the next two days, as a day trader I would be looking to go long, rather than short. As a swing trader/investor I would wait for more confirmation to determine whether this rally is just an aberration or is it for real.
A comment was posted by Sanjay in yesterday’s post asking whether we are in corrective wave C of major wave 4 or otherwise. Well, Elliott Waves Analysis is a very specialized topic and while I have a working knowledge of Elliott Waves, I wouldn’t call myself a specialist. But, as far as my knowledge goes I have tried to do an analysis of the wave counts in the cycle/super cycle degree. I would request specialists of EWs to post a comment (if they happen to chance by this post) to tell us all if our analysis seems to be correct or not.
 Pasted above is the monthly chart of Nifty along with the wave counts (as I perceive them). Our counts start from the low made in April 2003 at 920, the place marked ‘0’. In my opinion this wave lasted upto Jan 2004 when it made a high of 2014.65. The wave 2 corrected a little more than 61.8% of wave 1 upto a level of 1292.20 in May 2004. Then started the major wave 3 which ended in Feb 2007 after making a high of 4245.30, which turned out to be slightly more than 261.8% of wave 1 (269.77% to be more precise). One can also see another 5 wave structure in wave 3 as marked by the numbers in brown. The corrective wave 4 was rather a small correction. Wave 2 having corrected 61.8% of wave 1, one would have expected wave 4 to correct 38.2% of wave 3 to a level of 3117 but it managed to correct only 23.6% of wave 3 upto 3554.50 in March 2007. Wave 5, according to me, started from there to end in Jan 2008 at 6357.10. With the wave 5 (2802.60 points) almost as long as wave 3 (2953.10 points), yet falling short of the length of wave 3, it is in conformation to the Elliott Wave principles that wave 3 is usually the longest but never the shortest. So from Jan 2008 till now we have been in the corrective waves A,B,C of the complete bull market cycle. And, we have now, probably, seen the end of wave C after the 3-3-5 pattern that it followed while completing waves A, B and C.
From hereon, if our wave counts are correct, then our previous low of 4093.20 made yesterday should not be broken. However, there is only two things that are worrying me and the first one is the fall of the government. While the market has already discounted the fact that the government would fall, yet a sharp knee jerk reaction could come which, probably, could take us below the previous low. The other thing that is worrying me is the fact that we are only 25 weeks or 6 months into the bear market. Usually, Fibonacci numbers hold a lot of importance in the markets and one of my previous posts mentions how the market made important highs/lows after a specific number of weeks and how that number always turned out to be a Fibonacci number. Going by that logic we should see the end of the bull market in 34 weeks which should not happen earlier than the last week of August.
Let us assume that our above logic is wrong and that our wave counts are correct. In that case a new bull market should start now. But do we expect new highs soon? No. A new bull market will always take time to build up. A long period of base-building will happen in the beginning of a bull market. There is a lot of pessimism when the first wave up of the bull wave is seen and people view it as a bear market rally rather than a bull market. The second wave down reinforces the fear that the bear market is continuing. It is only when this wave fails to go below the previous lows and another rally is seen that people realize that it is a new bull market. That is when the volumes come in and people come and buy in large numbers. Exactly the reason why the third wave is the longest wave. Then a correction comes about and the fourth wave down just cools down the overheated market and makes valuations appear a little more reasonable and the fifth wave starts. Now the people again come out in hordes to buy and think that since this is a bull market nothing could go wrong and conditions become euphoric and one knows that it is all about to end soon. Sir John Templeton, a famous stock investor, has rightly said that “Bull markets are born on pessimism, grow on skepticism, mature on optimism, and die on euphoria.”
Right now the conditions are pessimistic, there are rumours of a government fall, I am expecting the markets to stay low till end of August and there are analysts predicting the Sensex to come down to 12000 levels and there are a few analysts who are pessimistic enough to expect 9000 on the Sensex and some like me who once predicted the target of Nifty to be 2600. There is a lot of pessimism around and I am wondering if this is the birth of a new bull market?
Please do subscribe to my posts, so that all posts are delivered free to your inbox and you don't miss any useful analysis of the markets in the future.
Happy Investing!!!
Wednesday, June 4, 2008
How Low Can the Markets Stoop?
The Nifty opened today with a slight negative bias. It remained like that for the first couple of hours or so and then staged a seemingly smart recovery but again found resistance near the highs of the day and in the afternoon, probably, when the European markets started opening that we started coming down, and pretty heavily too. It was a, virtually, one way slide for the Nifty and finally it found support at 4564.50, again very close to our support which we had been predicting between 4500 and 4550. So, yesterday’s doji could not force a turnaround for the markets. The bears weighed much more than the doji.
 Attached above is the daily chart of the Nifty. Some interesting things can be seen on this chart. First of all, our first support at 4630, the previous low formed in early April could not hold today and was broken through effortlessly. Secondly, a trendline which has been in place since August 2007 was also broken through today. This could be significant for the market. The only ray of light that we can see in this dark tunnel is the Jan and Mar lows. They could, only could, provide support to the Nifty between 4450 and 4470. Below 4450, we don’t know where the bottom is. It could be 4100 or 4200 or even lower. As of this moment, there is no strength seen in the markets. It is looking all gloomy right now.
 I was trying to see if this trendline, which has been marked with the green arrow, was very significant or not. For that I had to see whether it extended back into time or not. And it was then that I came upon a very
interesting disheartening chart, the weekly chart of the Nifty. And I was shocked to find that this same trendline had actually started in April 2005 and had provided support to the Nifty 8 times in the last three years. And if this three year long trendline is decisively broken, then it could be very very significant for the market.
This is disheartening in itself that the long term bullish trend could now be broken. But what are the implications? What is the target? Can we ask the market how low it can go? The answer may be visible in this chart itself. Attached below is the same weekly chart of Nifty but zoomed in to show the period from Feb 2007 onwards. Could this be called a bearish head and shoulders pattern? Well, I’m sure it can be. The neckline, of course, is not straight but it doesn’t have to be. There are head and shoulders pattern which work very well with slanting necklines too.
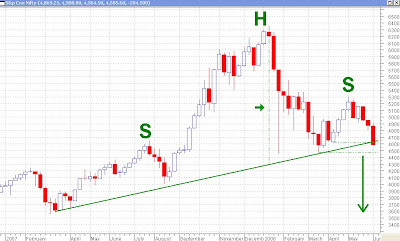 What is disheartening is the fact that the market is virtually shouting from the rooftops to exercise caution. It is telling us that it could stoop down shamelessly to levels which we cannot even think of. But, of course, only after this pattern is decisively broken. The dashed vertical line marked with the arrow shows that the high was close to 6300 when the neckline was near 4300, a difference of 2000 points. And if it is broken and the breakout is considered to be at 4600 then we are looking at a target of …. Hold your breath ….. 2600.
Can this pattern fail? Well, definitely it could. There have been various instances of head and shoulders patterns failing in the past. Uma could vouch for that. She has experienced three head and shoulders patterns failures in Reliance in a single day. Believe me, this is one occasion where I would really hope for this pattern in Nifty to fail. I have a lot of long term positions which I would have to sell in a loss if the Nifty were to go below the previous low at 4450.
After this chart and analysis, I can’t seem to get any more words out of mymouth fingers. All I can say right now is just the three golden words – EXERCISE EXTREME CAUTION.
Please do subscribe to my posts, so that all posts are delivered free to your inbox and you don't miss any useful analysis of the markets in the future.
Happy Investing!!!
 Attached above is the daily chart of the Nifty. Some interesting things can be seen on this chart. First of all, our first support at 4630, the previous low formed in early April could not hold today and was broken through effortlessly. Secondly, a trendline which has been in place since August 2007 was also broken through today. This could be significant for the market. The only ray of light that we can see in this dark tunnel is the Jan and Mar lows. They could, only could, provide support to the Nifty between 4450 and 4470. Below 4450, we don’t know where the bottom is. It could be 4100 or 4200 or even lower. As of this moment, there is no strength seen in the markets. It is looking all gloomy right now.
 I was trying to see if this trendline, which has been marked with the green arrow, was very significant or not. For that I had to see whether it extended back into time or not. And it was then that I came upon a very
This is disheartening in itself that the long term bullish trend could now be broken. But what are the implications? What is the target? Can we ask the market how low it can go? The answer may be visible in this chart itself. Attached below is the same weekly chart of Nifty but zoomed in to show the period from Feb 2007 onwards. Could this be called a bearish head and shoulders pattern? Well, I’m sure it can be. The neckline, of course, is not straight but it doesn’t have to be. There are head and shoulders pattern which work very well with slanting necklines too.
 What is disheartening is the fact that the market is virtually shouting from the rooftops to exercise caution. It is telling us that it could stoop down shamelessly to levels which we cannot even think of. But, of course, only after this pattern is decisively broken. The dashed vertical line marked with the arrow shows that the high was close to 6300 when the neckline was near 4300, a difference of 2000 points. And if it is broken and the breakout is considered to be at 4600 then we are looking at a target of …. Hold your breath ….. 2600.
Can this pattern fail? Well, definitely it could. There have been various instances of head and shoulders patterns failing in the past. Uma could vouch for that. She has experienced three head and shoulders patterns failures in Reliance in a single day. Believe me, this is one occasion where I would really hope for this pattern in Nifty to fail. I have a lot of long term positions which I would have to sell in a loss if the Nifty were to go below the previous low at 4450.
After this chart and analysis, I can’t seem to get any more words out of my
Please do subscribe to my posts, so that all posts are delivered free to your inbox and you don't miss any useful analysis of the markets in the future.
Happy Investing!!!
Monday, June 2, 2008
Bloodbath on the Streets! 4500 Visible
It was a bad day for the markets today. The Nifty opened flat today and tried on three occasions to go above 4900 but could not sustain itself at those high levels. And by 11:40, it was clear that the Nifty would come down. But what ensued was not what had been anticipated by day traders. The Nifty dropped almost 180 points from the highs of the day. By the end of it all, everything was looking red, the screen was red, the charts showed all red and there was ‘blood on the street’, again red.
However, it wasn’t such a bad day for technical analysts. The swing traders had already anticipated a fall when the Nifty went below 4990. All stop losses for long positions were hit and they were, and still are, merrily sitting on cash, anticipating further downfall. While they do have a target in mind (in my case, it is between 4500 and 4550, and some are even anticipating 3800), they will buy only when the Nifty gives a signal to buy. It may mean missing out on a small portion of the decline/rally but it captures most of the move. There are different theories in technical analysis – one which tells analysts to execute their trades when the target is achieved and another which tells us to buy or sell only when a buy/sell signal is received. I like to follow both theories. For example, in this case, I would look to invest 50% of my money when the target is achieved i.e. when the Nifty goes below 4550 and I would invest the remaining 50% when a buy signal is received, even if it comes at 4800. Both methods have their own pros and cons and I will, probably, talk about them in one of my weekend posts which come under the ‘Lessons on Investing’ category. You can click on “Lessons on Investing” anytime in the label cloud on the right to read such posts.
However, it wasn’t such a bad day for technical analysts. The swing traders had already anticipated a fall when the Nifty went below 4990. All stop losses for long positions were hit and they were, and still are, merrily sitting on cash, anticipating further downfall. While they do have a target in mind (in my case, it is between 4500 and 4550, and some are even anticipating 3800), they will buy only when the Nifty gives a signal to buy. It may mean missing out on a small portion of the decline/rally but it captures most of the move. There are different theories in technical analysis – one which tells analysts to execute their trades when the target is achieved and another which tells us to buy or sell only when a buy/sell signal is received. I like to follow both theories. For example, in this case, I would look to invest 50% of my money when the target is achieved i.e. when the Nifty goes below 4550 and I would invest the remaining 50% when a buy signal is received, even if it comes at 4800. Both methods have their own pros and cons and I will, probably, talk about them in one of my weekend posts which come under the ‘Lessons on Investing’ category. You can click on “Lessons on Investing” anytime in the label cloud on the right to read such posts.
 We have the daily chart of the Nifty with us today. I’ve not included many things on the charts today, so as to keep it very simple for the readers. I am now going to explain what I have included, what my reading is about the chart and why I feel so. I always like to give reasons for my analysis and it is there for everybody to see. As you can see from the chart, there are two trendlines – a downward sloping dashed trendline and an upward sloping solid trendline. The solid trendline shows where the Nifty broke through the support line and showed that a downtrend could start. And the dashed trendline shows the level above which the Nifty should come back in an uptrend. As one can see, and as has been mentioned, a downtrend was signaled when the Nifty came below 4990 and an uptrend would be signaled when the Nifty crosses the dashed trendline which today stands at 5020. Since this line is sloping downwards, this level would keep changing everyday.
The next thing that can be seen from the chart are the two vertical dashed lines marked ‘A’ and ‘B’. Line A measures the distance from the top of the recent uptrend to the trendline on that day. This line A has then been superimposed at the point where the Nifty broke through the trendline and this superimposed line is marked as B. The logic is that the downtrend should be as brief (or as severe) as the uptrend was, though, in some cases there is a possibility of it getting extended too. This superimposed line, thus, gives us a target of 4530 on the Nifty. Since this target is usually not exact, I’m taking it as between 4500 and 4550. You will notice that the same principle is used when calculating the targets for head and shoulders patterns, double/triple tops/bottoms. If you look at the pattern formed from where the solid line starts to where it ends, it does look like a head and shoulders pattern, though, with a very slanted neckline. You will also notice that the Relative Strength Index (RSI) has made a much easier to imagine bearish head and shoulders pattern. Also, one should notice the RSI within the small circle. Since the last week, the RSI was repeatedly finding support at 40, which in itself is not a bullish sign, but is definitely a positive sign which suggests that the market was showing some strength because of which the RSI was finding difficulty going below 40. This strength has been negated today with the RSI advancing to levels lower than 40.
Again, we are not looking at charts of any stocks these days because it is not the time to buy as we are still in an intermediate term downtrend. When the market again shows signs of improvement and there are some buying opportunities available, some of them worth a mention would find their way through on this page.
Please do subscribe to my posts, so that all posts are delivered free to your inbox and you don't miss any useful analysis of the markets in the future.
Happy Investing!!!
Wednesday, May 7, 2008
All Set to Go North
If you remember yesterday’s edition, I had mentioned that the Nifty may touch the 1 month long trendline and bounce back from there. That is exactly what happened today. The Nifty stayed within a narrow range throughout the day, but did go low enough to touch not only the trendline but also the support provided by the 23.6% Fibonacci retracement at 5102.25. We had also mentioned that Fibonacci retracements are sometimes pretty accurate. Talk about accuracy and we see that the Nifty made a low of 5101.50, accurate upto 1 point.
 Other signs of support being provided are that even though the Nifty came down about 50 points today, the RSI kept hovering around the same levels and did not break 40. Both the price touching the trendline and the RSI finding support at 40 has been marked by blue circles. While the Nifty still did close in the red today but a bounce back from 5101 to 5140 in the last hour is a pretty good indication that the correction may be over.
I am a firm believer in blue chips. Over the years, I have seen lots of ups and downs in the markets and it is always the blue chips which have the power to surpass their previous highs, no matter what they are. I know there are many buyers out there with purchases of L&T above 4500 and Reliance above 3300. They may be sitting on a loss today but with just a little patience I’m sure they will end up in a profit.
Mid caps and small caps have their advantages too. We can take advantage of the momentum and speculation in such stocks. The only problem comes when we are holding these stocks and the market crashes. Technical Analysis gives us clear targets and stop losses. And without fail one of these levels is touched before the other. While we are better at closing positions near the targets (though, greed stops us sometimes), we are horrible at booking losses. This is where the third biggest enemy of ours (after greed and panic), hope, comes into play. It stops us from booking losses because we have seen on a number of occasions when the prices bounce back after our stop loss is hit. But when following technical analysis, discipline is very important. It is only the disciplined trader who wins over the others. But I know 80-90% of traders are not disciplined. And they always get stuck with small caps and mid caps during market crashes. And which is why I try recommending only blue chips. It is only during times like today when there are no blue chips available, that I take the help of other stocks. But it has to warned that discipline is very important when taking such trades.
 Larsen and Toubro seems to have broken through its downward sloping trendline and seems to have completed a pullback to the trendline too. The doji day today (open and close at almost the same levels) suggests that the price may start going up tomorrow onwards. It seems to make sense because the RSI too has broken through its trendline and has gone through a pullback after the breakout so it has been moving in tandem with the price. It looks set for a target of around 3600 with a stop below 2890.
 Gokaldas Exports, a midcap stock, but a market leader in its industry of readymade apparels, also has made a bullish pattern on the charts. With the volumes not showing anything except the breakout volumes today, can’t say whether it is a true head and shoulders pattern or not but it definitely looks like one. With a stop loss below 204, one can buy it above 235 for a target between 290 and 300.
Please do subscribe to my posts, so that all posts are delivered free to your inbox and you don't miss any useful analysis of the markets in the future.
Happy Investing!!!
Monday, May 5, 2008
Markets Move in Expected Direction
As expected, the Nifty did come below the upward sloping trendline and is now ready for a (hopefully, small) downmove. As discussed yesterday, the Relative Strength Index (RSI) of the Nifty has also now confirmed the bearish head and shoulders pattern. We can hope for the Nifty to cool down for sometime but upto what level that is a little difficult to say.

Hopefully, we can come to know about the possible levels with the help of the chart below, which is the 60 minutes chart of the Nifty. If we see the chart we can see that this upmove started on 18th March 2008 from a level of 4468.55 and the high was made yesterday at 5298. If we apply the Fibonacci Retracements to it, we can see that the 23.6% retracement is at 5102.25 and the 38.2% retracement at 4981.15. At the moment we are not looking at a move below this level, though, I feel 5100 should be a good level to bounce back from. Of course, conditions may change, circumstances may change.

Note: I still remember about my promise about writing more on Fibonacci in one of the weekend posts. Let me finish with my series on the Mutual Funds first and then I’ll do it. Maybe I’ll do a webinar on it.
No stocks being discussed today. Let us wait for the market retracement to finish and see where support is found.
Okay, and just before I sign off for the day, a small quiz for you. Do you know why we keep using the terms ‘Bulls’ and ‘Bears’ in the stock market? I found the answer at Digital Inspiration, which says that “According to Motley Fool, a bear market earned its name because bears tend to swat at things with their paws in a downward motion (as in "the market's going down"). A bull market, on the other hand, got its name because bulls swing their horns upward when they strike (as in "the market's going up").”
More in the next newsletter.
Please do subscribe to my posts, so that all posts are delivered free to your inbox and you don't miss any useful analysis of the markets in the future.
Happy Investing!!!
Thursday, January 31, 2008
More Downside Expected
Some new pages have been added into this site yesterday, which give good information and news about the Indian and the World markets. Please click on the tabs on the top to go to the other pages. For now, one would have to refresh the page at short intervals so that the most recent data is available in front of you but we are trying to incorporate a feature of automatic updation, which may take a couple of days. I need help of some tech savvy people who can help me to incorporate this feature. Those willing to help may please contact me.
 Looking at the 30 minute chart of Nifty today, we find that we are in a short term downtrend now. We had another lower high and a lower low, as well. And in the process the Nifty broke through its short term trendline, had a small pullback and found resistance at the same trendline and turned down again. In the short term we have a small support near 5070 but as of now, there are no indications that it will hold. We have some resistance near 5300. As already mentioned, we are in an intermediate downtrend and will remain in one for some more time, or at least till the time 5500 is breached on the upperside. This level may change with time. Below 5070, we may be looking at a target of 4900.
It was the day of the Futures and Options expiry today. Tomorrow, and maybe Monday, there will be some build up of positions in the new month, which may be a cause for some volatility. After that the volatility may decrease and then only can we get a clearer picture of the direction of the Nifty. For short term traders, one should take only short positions and some of them have been identified here.
 Air Deccan has a little support near 168. If this support breaks, it may come down to 140. Sell near 167 (stay away in the first 15 minutes of the morning) with a stop loss of 185 for a target of 140-142.
 Allahabad Bank seems to have made a small head and shoulders pattern, which is bearish for this banking stock. Notice the sudden increase in volumes in the last half an hour when the stock broke through the neckline. Look to sell below 107 with a stop loss of 118 for a target of 96.
 Bata India has also made a bearish pattern with a breakdown below the support at 167 with a sudden increase in volumes on breakout. This shoe company looks as a good selling opportunity below 160 with a stop loss at 180 for a target of 135.
 IDBI is another shorting candidate after it completed its bearish head and shoulders pattern. With a stop loss above 118, it seems a good sell below 110 for a target of 96.
 MTNL has also made a bearish pattern with a breakdown below the neckline at 119 with a sudden increase in volumes in the last half hour. This telephone company is a good shorting opportunity below 118 with a stop loss at 126 for a target of 103.
 Network 18 also seems to have made a head and shoulders pattern with the head and the shoulders marked in the chart. With a stop loss of 350, it seems worth selling below 320 for a target of 285.
 Under normal circumstances, whenever the price increases, the volumes also should increase, as has been happening in this 30 minutes chart of Reliance Natural Resources Limited (RNRL). This has been marked by the blue lines in the chart. But notice the price and volume pattern in this last increase and decrease (marked by the thick purple lines) where volumes fell when the price was increasing and volumes rose when the price was falling. This is a bearish sign and RNRL has also failed to reach its upper resistance of 150. One can profit from selling it below 130 with a stop loss of 143 for a target of 110.
Please do subscribe to my posts, so that all posts are delivered free to your inbox and you don't miss any useful analysis of the markets in the future.
Happy Investing!!!
Monday, January 28, 2008
Markets Remain Volatile
Whenever we trade in the markets, we either make a profit or we make a loss. Without any research and doing blind trades, our probability of making a profit is 50% (though, many of us would disagree, since more often than not, markets end up giving a loss rather than a profit). With Technical Analysis, we tend to increase our probability of making profitable trades, though only marginally. Technical Analysis helps us increase the probability to about 70%. And if we follow it religiously, we end up in the green over a period of time. Sometimes, markets do go against us even after proper fundamental and technical research. At those times, it is best to get out of losing trades with pre-decided stop losses. In volatile markets, such as these days, all our research may go for a six and these are the sort of days where stop losses come in handy. But to take profits from the markets, one has to accept losses too. That is a risk which one HAS to take.
 The Nifty, as predicted in my earlier newsletters, is likely to remain in the broad range of 4500 to 5500 for sometime. A clear direction of the market can be predicted only after one of these levels has been broken. Till then, global and domestic events will keep disturbing the direction of the markets. In other words, till the global situation does not stabilise, we are likely to remain within this range and volatile movements, including gap up or gap down openings, are to be expected. In the long term the market is expected to remain bullish (at least till the time Nifty remains above 4500) and investors should buy on every dip. Traders should remain cautious with stop losses and should hedge their positions, or stay out of the market completely.
 Hero Honda seems to be making an inverted head and shoulders pattern and a break through the trendline should confirm this pattern. Ignoring the movement in the first 15 minutes tomorrow, if it crosses above 710 after that then this pattern should be confirmed. One could consider buying it above 710 with a stop loss below 680 for a target of about 800.
 IDBI seems to have broken out of this consolidation pattern and looks like it has started its upmove. A buy above 128 with a stop loss below 115 should give us a decent target of around 150. Avoid taking positions within the first 15 minutes of the opening of markets.
 Same goes for Indian Hotels. This is looking very bullish to me. It not only seems to have broken out of the consolidation pattern but also has broken its downtrending line, which suggests that the uptrend may have resumed in this. Not sure about the price, but the RSI (Relative Strength Index) making an inverted head and shoulders pattern seems to confirm that the downtrend may be over. One could consider buying it above 142 with a stop loss below 125 for a target of 170.
 I wonder whether this price chart of Tata Tea can be termed as an inverted head and shoulders pattern or not. Even if we consider that it is not a bullish head and shoulders pattern, then also it seems to have finished its downtrend. Not giving any targets as such, but buying it above 800 tomorrow with a stop below 740 should be a profitable move. It may face resistance between 950 and 1000.

Union Bank seems to have made a clear inverted head and shoulders pattern. Buying above 215 with a stop loss of 195 should be profitable for one who buys it. The target for this pattern could be between 260 and 270. It may face minor resistances near 225 and 235. While buying this should be profitable, yet one should be very careful because it is often said that "Clearer the pattern, the more likely it is to fail."
Please do subscribe to my posts, so that all posts are delivered free to your inbox and you don't miss any useful analysis of the markets in the future.
Happy Investing!!!
Subscribe to:
Posts (Atom)