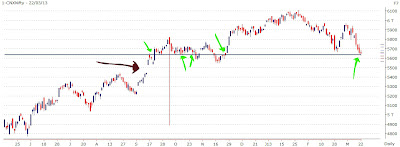
There is nothing new to suggest or to recommend. It is clear from the pattern that the Nifty is displaying, that we are in a downtrend and sufficiently clear that we may go down further. The suggested levels of 5528 are now looking like a bright possibility. Our first analysis of the market had suggested that we may revisit levels of 4300 once again. Now, whether the market actually goes to 4300 or not, it does not matter. While we will continue to remain short till those levels, we should also be wise enough to exit from shorts when we start getting signals that the downtrend may have finished. Let us look, once again, in detail about the next short term targets for the Nifty.
Attached above is the daily chart of Nifty. As seen from the chart, the previous low of 5663, which was made earlier this month, was taken out on Friday when the Nifty made an intra-day low of 5632 and finally closed at 5651. Since the previous low was taken out, we can safely say that the trend continues to be bearish. However, we need to be careful around these levels. What's shown on the chart above is a blue horizontal line and various green arrows. The horizontal line has been drawn at a level of 5630 and the green arrows show that the Nifty had either found support or a resistance at around these levels. Not only these shown in this chart, the same line seems to have provided support/resistance to Nifty back in time too (on the weekly charts). A resistance was provided by this line to the Nifty in Sep 2010, a support was then provided in Jan 2011 and then a resistance a year later in Feb 2012. This line has been tested various times and has been a multi-year support/resistance level. We should be careful around these levels. On Friday, the Nifty again found support near these levels. It is going to be slightly difficult breaking this level. A normal bounceback could take the Nifty upto 5700 levels from here. Above 5700, we must exit our shorts and get into short positions again at slightly higher levels (above 5800, maybe). Meanwhile, a move below 5630 means that the short position should continue. In case it continues to go down, we may see support available near 5580, 5550 and 5520. However, I feel, a gap which was formed in the Nifty chart in Sep 2012 (marked by the brown arrow) may be filled now and in case this gap is filled, we shall be looking at a support of 5450 after that.
The hourly chart of Nifty also suggests small signs of recovery in the near future. The stochastics is in the oversold region and is showing signs of improvement, while a bullish divergence is visible both in RSI as well as MACD. A move below 5630 may cancel/postpone this bullishness seen on the charts. A recovery from her could find resistance near the 5700-5720 levels and an upside breakout above that could take the Nifty to 5775-5800 levels. It is suggested not to take any long positions even above 5720 because the trend clearly is downwards and such rallies may be too short lived to take long positions but could be dangerous enough to create panic within us. Therefore, short positions may be closed above 5720 and a rise to 5800 may be used to build long positions again at around 5800.
Please subscribe to my posts to get all future new posts directly into your email so that you get the earliest information about the next direction of the markets.
Happy trading!!!

No comments:
Post a Comment