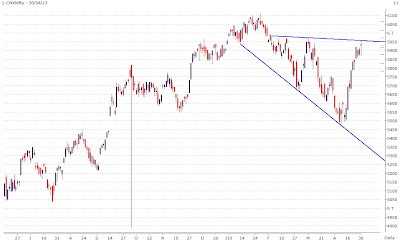
The Nifty, on Tuesday, opened with a gap up near the highs of the day touching a high of 5962, just 9 points shy of the crucial resistance of 5970. But those highs were not seen for long as it began its slide down soon after opening and made a low of 5868 by mid afternoon and then started a very smart recovery to close near the highs again, though, just a few points in the red near 5930. The candlestick pattern seen on the daily charts is what is known as a Hanging Man. For a detailed analysis of the Nifty, continue reading.
Attached above is the daily chart of Nifty. As seen on the chart by the trendlines, it can be seen that Nifty has reached the resistance zone. And near the resistance zone, it has formed a bearish hanging man candlestick pattern. Well, almost. There is a very close resemblance. What is looking different is that it has a slightly longer upper shadow than what it should have. A hanging man pattern is generally formed near the end of uptrends. Technically speaking, this kind of a candlestick in isolation is actually hinting at the bulls having an advantage. The reason for that is that even though the bears had initiated snatching control from the bulls but by the end of the day, the bulls had regained all of it. But why it hints at a possible reversal in an uptrend is because such a sell-off during the day hints at the possible direction that the trend can take in the days to come. Theoretically speaking, a hanging man patterns needs further confirmation in the form of a long red candle the day after. This means that we can assume that the Nifty will finish the uptrend here in the event of these 3 conditions happening:
- Tomorrow, the 2nd of May, is going to be a red candle day.
- There is a breakdown in price tomorrow or in the next one or two trading sessions below 5868.
- The high of 5962 is not breached till then.
But we are getting some conflicting signals here. Another pattern that can be seen on the chart above between the two trendlines is a broadening formation. Now theoretically speaking (again), a broadening formation is a bearish pattern. What creates a little bit of doubt is that it is a broadening formation with a flat top which could turn out to be bullish too. What will give us a confirmation of this bullishness is a close above 5980. As long as it does not do that, it may go down for another plunge to the bottom of the river before bobbing its head back up over the surface to breathe. The only problem that it faces right now is that it is being carried into deeper waters and now the bottom according to the lower trendline may come in close to the 5300 levels. Of course, it may go only half way down to 5650 before rising again and in that case it will become an inverse head and shoulders pattern which is again a bullish sign. Whatever it is, puts should be bought into again keeping 5980 as a stop loss level. Currently the 5900 put is trading near Rs.84/-.
So, the strategy is clear. Buy puts now as it is a low risk instrument. Fresh riskier short positions should be created only below the nearest support at 5850. A move past 5980 should be used to close short positions including the puts being bought here. In case any long positions are currently being held, they should be closed here.
If you like the analysis here, you can subscribe to the posts feed or you can follow me on twitter, add to circles on google plus or befriend me on facebook.
Happy trading!!!

No comments:
Post a Comment