The Nifty, on Tuesday, opened with a gap up near the highs of the day touching a high of 5962, just 9 points shy of the crucial resistance of 5970. But those highs were not seen for long as it began its slide down soon after opening and made a low of 5868 by mid afternoon and then started a very smart recovery to close near the highs again, though, just a few points in the red near 5930. The candlestick pattern seen on the daily charts is what is known as a Hanging Man. For a detailed analysis of the Nifty, continue reading.
Showing posts with label Candlesticks. Show all posts
Showing posts with label Candlesticks. Show all posts
Thursday, May 2, 2013
Sunday, March 17, 2013
Nifty Weakness Continuing, Next Target 5528
As I have been saying since over two months that the Nifty looks weak, the Nifty, as if listening to my analysis is doing exactly as I am predicting. This is not a good sign, at least not good for me. And the reason for that is that the market does not listen to any analyst and moves in a fashion known only to itself. And since there are a limited number of movements that the market can show, a few analysts may have their good days till the market decides to bring them back to Mother Earth. Not a good sign for me, because I'm having good days these days and only the market knows, how many days to prove me right. But, never mind that, my job is to analyse the markets and take trades in the direction of the trend and not try to fight and change the trend when the markets decide so.
Friday, March 1, 2013
A View on the Forex (Foreign Currencies) Market
So, as expected, the market has fallen. It was probably holding on just because of the budget. As expected, the budget (being the last of the UPA - 2 regime), couldn't have been a reformist one. And because of the condition the country is in, it couldn't have been a populist one too. We are in dire need of money. With no reforms, it is sure to have an effect on the equity markets. Not only that, it will also affect the Forex markets and the Commodities markets. This post discusses just that - the effect of the Budget 2013 on the Equities, Commodities and Forex space.
Thursday, November 1, 2012
A Sudden Bullishness Seen on Bearish Charts
In the first half of the day, the Nifty was still uncertain about which way to go. It opened slightly in the positive, came down in the red, went to the greener territories again and then back into the red. Just like a yo-yo. But then a surprise came. The Nifty suddenly started going up at around 1 pm and then there was no looking back for it. It went up as if it was never bearish. But does that mean the bearishness is over. Maybe, but we would need more confirmation before we change our view to bullish. What's going to happen in the future, only the market can tell us. We can only make predictions and predictions can sometimes go wrong too. The only mantra to success is that we recognise the change of trend as early as possible and not try to fight the markets when the markets have proved us wrong. Maybe, just maybe, what we saw today was the first sign of the trend changing.
Friday, September 19, 2008
Rakesh Jhunjhunwala Positive On the Markets
Since a number of days now, I have been talking of a target of 3800 on the Nifty. This morning because of the global weakness the Nifty opened weak and touched that target of 3800. In fact, so close was the prediction that today’s low on the Nifty happened to be 3799.55. And once the target was achieved, the Nifty started moving up. The move up was steady and consistent and so good was the recovery that the Nifty finally managed to close near the highs of the day with a gain of 30 points. The high made today was 4050.10, which means an intraday recovery of 250.55 points. Such a good day changes the outlook totally. Crude, as of now, is trading flat near $96 while gold, after a stunning $70 rise yesterday is up again by $46 or 6%.
 Seen above is the daily chart of the Nifty. Three days out of the last four have displayed candles with long lower shadows, as marked by the green arrows. Two of these candles have very small bodies and, in comparison, very long lower shadows. Today’s candle, in candlestick charting parlance, is also called a hammer. And it is named a hammer not only because it looks like one but also because such candles are found near the end of a downtrend and it is said that such candles are ‘hammering out a base’. Options outlet says the following about a hammer.
  So, is this the end of the bear market? Well, we can’t say for sure. The prices have started ‘hammering out a base’, inflation has stabilized, crude prices have softened and India does not seem to be having too much of an impact of the credit crisis in the US. Who knows, this may be the end of the bear market. But hey, look at the world around you. There is so much of pessimism around. Surely, India cannot remain insulated from the problems in the rest of the world. Hmm, maybe it cannot. Or maybe it can. But as far as pessimism around the world is concerned, I would again like to point out what Sir John Templeton said. He said that “Bull markets are born on pessimism, grow on skepticism, mature on optimism, and die on euphoria.”
Rakesh Jhunjhunwala, according to Moneycontrol says that India is still in a long term bull market and that the current phase is only an interruption to that bull market. His logic is simple. That had we seen the market rise from 3000 to 13000 and then come down to 11000, it would have been termed as a correction. Now when we have seen so much of greed and so many excesses that the markets went to 22000 and then came down to 13000 then why are we not calling this phase a correction too? Shireen Bhan, in that context, in conversation with him mentioned that we have recently seen ‘the mother of all bull markets’ to which Rakesh Jhunjhunwala immediately disagreed and said the ‘the mother of all bull markets’ was yet to come. This conversation with Rakesh Jhunjhunwala will be telecast on CNBC this Saturday at 7:30 pm or Sunday at 10:30 pm. Watch it.
Shankar Sharma of First Global, though, remains a bear and says that the Sensex may not be able to reconquer its previous highs for the next 2-3 years and that it may come down to 10000-11000 levels.
But Vikas, where does that leave us? Do we remain bullish or bearish? Well, I have given you both sides of the market. You decide for yourself what you want to be. I, personally, am not too bearish on the markets, especially after seeing the candles formed in the last four days.
Please do subscribe to my posts, so that all posts are delivered free to your inbox and you don't miss any useful analysis of the markets in the future.
Happy Investing!!!
Thursday, July 31, 2008
Nifty Displays 'Three Black Crows' Candlestick Pattern
There was good news from the American and Asian markets this morning. The Dow was up 266 points and all Asian markets were between a percent to two percent in the green. Because of these reasons, the Nifty opened with a positive bias and continued to take prices up throughout the day. With so much of cheer the world over, our markets happened to be cheerful too and the Nifty ended the day 123 points in the green while the Sensex closed 495 points above yesterday. There was good news from Europe as well. The closing was good two. Both the London FTSE and the French CAC closed almost two percent up while the German DAX ended with a gain of a percent. The news from around the world may not be all that good tomorrow. The American markets opened in the green today and while the Dow Jones has lost all its gains by now, the Nasdaq is already in the red. The crude front is also not looking all that healthy today with the crude already trading above $127 a barrel.
 Attached above is the daily chart of Nifty. The Nifty, as can be clearly seen, has reversed after testing the top of the trend channel. This was expected since the 4180-4200 support is quite a strong support. Yesterday we did see the Nifty go down to a level of 4160 intraday but it closed at 4190. If we have another day of upmove tomorrow and if the prices were to go above 4350, we would have a pivot low in place at 4160. A pivot low formed at 4160 would mean that the Nifty has finally formed a pattern of higher highs and higher lows, which would bring the Nifty back in an uptrend. Back in an uptrend means, we should be buyers now and our stop loss for all long positions should be the most recent pivot low at 4160. But before we go on to buy, we should be aware of the different definitions of an uptrend. Technically, a stock (or an index) comes back in an uptrend when it goes up, comes back down to form a low (which is higher than the previous low) and then goes back up above its previous high. Quite often the prices first go on to make a higher high (like the Nifty displayed this time around) and then form a higher low. Here there are two schools of thought. One says that the uptrend has started, whereas the other school waits for the prices to go back above its previous high (in which case it makes it two higher highs and a higher low) before buying. Needless to say, the second school of thought has a much better chance of making a profit. And it is also understood that it is the first school which buys at a cheaper price and makes more profits if the signal turns out to be correct for them.
I would normally side with the first school rather than the second but it all depends on the situation. At present, if the Nifty were to go above 4350 tomorrow, there is resistance close by near 4480 (this level will keep reducing every passing day) as suggested by the trendline. What if the Nifty were to reverse from this level? I’ll be making a profit of only 100 odd points, which is not much. Also, there is likelihood that the candlestick pattern formed here is that of ‘three black crows’, which gives a very negative outlook to the Nifty. Had the small narrow range blue candle, formed on Monday, not been there, this would have been a classic ‘three black crows’ pattern, which happens to be a reversal pattern. It is the presence of this blue candle that creates doubts. The ‘three black crows’ candlestick pattern usually follows a period of strong advance and within this pattern three black(in our case, red) candles/shaded candles are formed with non-existent or small lower shadows. These three candles have lower highs and lower lows. Usually, the fourth candle is a white/blue/unshaded candle but could also be a black/red candle. The fifth or the sixth candle, generally, takes the prices below the low of the ‘third crow’. If this does turn out to be a ‘three black crows’ pattern (ignoring the blue candle formed inbetween the crows) and the low of 4160 is broken in the next one or two days, we could be looking at a retest/breakthrough of the 3800 lows too. For now, I would much rather stay with the second school of thought and buy only if the Nifty were to go above its previous high of 4540.
Please do subscribe to my posts, so that all posts are delivered free to your inbox and you don't miss any useful analysis of the markets in the future.
Happy Investing!!!
Thursday, June 5, 2008
Candlesticks Piercing Pattern Made in Nifty Today
The Nifty today opened flat and remained so for the next 2 hours before it started slipping. It went on to make a low of 4536.25 which was very close to our support of 4530 as mentioned here. It was from here that the recovery started and what a recovery it was! A climb of more than 150 points from the day’s lows. It gave us a nice big blue candle, which was quite a relief after losing 350 points in 3 days.
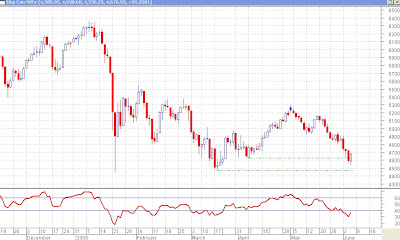 Seen above is the daily chart of the Nifty. Looking at the last two candles, according to candlestick charting, we got a very good piercing pattern. A small image is also given below to help you understand what a piercing pattern is.
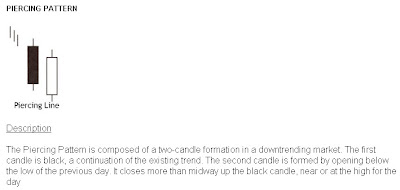 The criteria to recognise a piercing pattern is the following:
 Seen above is the daily chart of the Nifty. Looking at the last two candles, according to candlestick charting, we got a very good piercing pattern. A small image is also given below to help you understand what a piercing pattern is.
 The criteria to recognise a piercing pattern is the following:
 - The body of the first candle is black (shaded); the body of the second candle is white (unshaded).
- The downtrend has been evident for a good period. A long black candle occurs at the end of the trend.
- The second day opens lower than the trading of the prior day.
- The white candle closes more than halfway up the black candle.
If you notice these criteria, you would see that today’s pattern on the chart fits exactly with this. This may probably mean that this is the end of the downtrend, at least for sometime. For the time being, let us forget the head and shoulders pattern that we saw yesterday and hope for the best. More candlestick patterns can be read on this page.
I got a few mails today in response to the post I wrote yesterday. A lot of my readers were “disheartened” by my analysis of the markets and the ‘shuddering’ thought of the Nifty possibly going to 2600. One of them even asked me to ‘give some rays of hope’. I forgot that, like a doctor keeps giving hope and comfort to his patients and his/her family members even if the survival chances are bleak, I too, with so many blog readers, need to ‘give rays of hope’ when the markets are looking bad.
Yes, I understand that I may have painted a very grim picture yesterday but I thought my readers had to be aware of what could be a possibility. It is to be understood that it is only a possibility and not a certainty. More risk averse investors should be getting out of the markets if we were to go below 4450. And how will they exit if I don’t tell them where to exit? I have to cater to all audiences and it is my duty to bring out all possible scenarios. I admit that I may have erred by not including the positives in yesterday’s post.
Well, all is not lost yet. We have support at 4530, which held today. The three year trendline (and not the eight year trendline that one of my readers got confused with) that the Nifty might break is a very long trendline and one odd going through the line is not considered as a breakdown, it needs to be consistently below the line for a week or so to get a confirmation of a breakdown. Secondly, the head and shoulders pattern shown yesterday was on the weekly charts and took a year and 4 months to form and the target could take as long to be achieved. Markets change drastically in such a long time and such large patterns are more likely to fail than short term patterns. And today’s piercing pattern boosts our morale a little. All may not be lost yet.
In my webinar on moving averages I had mentioned that when multiple moving averages converge together or come very close to each other it means that a big movement is about to come. This is a derivative of the age old Dow Theory. One of the tenets of the Dow Theory is that ‘lines indicate movement’. By ‘lines’ Charles Dow meant the prices moving in a very narrow range or within a small rectangle. This narrow range usually indicates that a movement is about to come. About moving averages when they converge together it means the prices have been moving very close to a particular price level for long (in the present scenario the 5000 level) because of which all moving averages are also very close to each other. This indicates a ‘lull before the storm’ or that a big movement is about to come. This movement could be either up or down. On the past several occasions it has happened that after such a scenario the prices went up but they could very well go down too. This theory only states that a big movement will/may come and does not necessarily state the direction of the movement. One of my readers mistook it to mean that it meant prices would go up. In the present scenario all moving averages are pretty close to each other and they indicate that a big movement is likely anytime soon. This could be on the downside if we go below 4450 or on the upside if we cross 5300. Let us all hope for the best and let the markets decide which way they want to go.
In my post dated 27th May 2008, I had advised buying Nifty 4800, 4700 or 4600 puts or buying a 5000 call and selling 4600 or 4500 call. Let us see with the help of this table how much profit we would have made if we had followed any of those strategies on 28th May and covered the positions today with just one lot of Nifty (50 Nifties).
 Such good returns in a matter of only 8 days and that too when the market is going down and with a maximum investment of only Rs.16000 odd. And all these profits are on just one lot of Nifty. One with Rs.50000/- to invest could have bought 4 to 5 lots of Nifty options and could have easily ended up with more than a lakh in just eight days. Keep watching this space for more such strategies whenever they come. Subscribe to my posts now so that you don’t miss any such profitable strategies.
Happy Investing!!!
Tuesday, June 3, 2008
Another Attempt At Elliott Wave Counts
The Nifty, taking the cue from red global markets, opened weak and within minutes of opening reached 4634, very close to the support of 4630, as was mentioned in the post dated 25th May titled “Nifty Breaks Important Support”. And from there it staged a magnificient recovery. Unfortunately, the recovery wasn’t enough to take it into the green but it was enough to end the day to form a doji candle (open and close at or very close to each other), as can be seen in the chart below.
 As has been discussed in various earlier newsletters, a doji after a downfall is a bullish sign in the short term and the same after an upmove is a bearish short term sign. Now whether this doji is strong enough to take it up in the next 2-3 days or whether the bears win over this doji is yet to be seen. An upmove from this level could take the Nifty to 4800 where it should find resistance again. A downmove will have to go beyond 4630 to reach our estimated support between 4500 and 4550. There was probably another reason for the support found today, as can be seen from the trendline marked with the arrow.
I had written a post on April 21st titled "Are we in wave 3 of Nifty?" in which I had mentioned the basics about Elliott Waves. You can read that post before you continue ahead so that you can recall what I had written that time.
In response to that post, I received an email from a subscriber of mine who wrote the following:
“Dear Sir,
I want to ask you that are we in bullish phase, after the corrective phase of A,B,C? Previously you have written an article "Are we in wave 3?". In the same line I want to add that, now we are in WAVE 2, shortly will enter in to WAVE 3. Below I have given the image for right understanding.
Want to know your comment on it.”
He has been very kind to attach a chart also which is self explanatory and needs no commentary. It is attached below.
 While the chart is beautiful, in my view, the analysis seems to be incorrect, at least at this moment. In my earlier post, which you have just read, I had mentioned that wave 4 should never never come in the price territory of wave 1. If it does, it means that our wave count was incorrect. That counting went wrong on 9th May when the Nifty came below 4970.80 (the high of wave 1), which led to the conclusion that it was either wave 2 forming, as my subscriber suggests, or maybe some other numbering pattern. It now seems that it isn’t wave 2 also that is forming because our target for Nifty is much lower, between 4500 and 4550. If that does happen then this cannot be wave 2 because wave 2 does not, generally, retrace more than 61.8% of wave 1. In this case it has already retraced a little more than that. In my opinion, we are still in the corrective waves A-B-C, which can also take the 3-3-5 pattern which means that wave A and B would each consist of 3 waves while wave C would consist of 5 waves.
 In the chart above, I have numbered the waves A-B-C in large capital letters and the waves within these larger waves as 1-2-3-4-5 in smaller font. I think we have completed the 3 waves of the corrective wave A, the 3 waves of corrective wave B and are in the 3rd of 5 waves of corrective wave C. This 3rd wave could go between 4500 and 4550 from where we will have a small bounce back which would form wave 4 (not to exceed 4900) of the C wave and then a downfall again, which would take the Nifty to 4100-4200 (or lower??). That would, probably, be the end of the bear market from where it will be a new beginning. That is what the Elliott Wave Theory tells us right now. However, I must admit that I am not a master of Elliott Waves and the market could again prove my numbering to be incorrect, if it so decides. I, like all other analysts, respect the market and believe that market is supreme.
According to a1samud, there is a very famous saying by Mahatma Gandhi, which I quote below:
"A customer is the most important visitor on our premises. he is not dependent on us. We are dependent on him. He is not an interruption in our work. He is the purpose of it. He is not an outsider in our business. He is part of it. We are not doing him a favor by serving him. He is doing us a favor by giving us an opportunity to do so.”
I would like to twist it a little to fit the relationship of analysts and the markets. Here is my version of it:
"The markets are the most important element of our lives. They are not dependent on us. We are dependent on them. They are not an interruption in our work. They are the purpose of it. They are not an outsider in our business. They are a part of it. We are not doing them a favor by analysing them. They are doing us a favor by giving us an opportunity to do so.”
Please do subscribe to my posts, so that all posts are delivered free to your inbox and you don't miss any useful analysis of the markets in the future.
Happy Investing!!!
Monday, May 12, 2008
Markets Recover from Expected Support Levels
The markets started on a weak note today and had lost about 60 points on the Nifty within the first half an hour and then started making a slow recovery from 4920. It took almost two hours for the market to recover all its losses for the day and just when it managed to reach yesterday’s prices at 4983, the industrial production data was announced. According to the data India's industrial production growth sunk to 3 per cent in March 2008 from 14.8 per cent a year ago and Index of Industrial Production grew at 8.1 per cent in FY 2007-08, down from 11.6 per cent in 2006-07. It took all of ten minutes for the markets to lose everything that it had gained in the last two hours, and even more. This time it made a low of 4915 and started its recovery from there.


This time around support was found at 4915, between our support levels of 4910-4930. And this time the buying seen seemed genuine because the Nifty recovered 97 points from the lows of the day and closed almost 30 points in the green. What triggered the buying is unknown. Maybe it was the technical support (between 4910 and 4930), maybe it was value buying (seems unlikely), maybe it was bottom fishing or bargain hunting (again unlikely because one doesn’t bottom fish when the sentiment is weak), but it definitely wasn’t the sentiment that had changed. A few days ago, in this column, I had mentioned that “technical analysis does help, but sentiment holds the key”. Is it time to change the phrase to – “sentiment doesn’t matter, only technical analysis helps”?
The Nifty is currently standing at resistance at 5020 as shown by the downtrending line. If it were to remain/go above 5020 after 10:30AM then its next target would be close to 5150.
The Nifty is currently standing at resistance at 5020 as shown by the downtrending line. If it were to remain/go above 5020 after 10:30AM then its next target would be close to 5150.
 On the daily chart of DLF, we can see that it has made a series of three doji candles (candles where opening price and closing price are the same or very close to each other) and suggests that the short term down trend may be over in this stock and it should see a reversal from these levels. Another positive in this chart is that the RSI is still above 40 and if DLF reverses from here then the RSI will also reverse and a reversal from 40 for the RSI is a good sign. The only negative that can be seen is that the RSI reversed from 60 when the last high was made and that means that it is still not in an uptrend. So, this time we should be careful when the RSI reaches 60 and should maintain a long position in the stock if the RSI were to cross 60. For now, it seems to be a good buy above today’s high of 640 with a stop loss near 607 for a target between 720 and 750 (and more if the RSI were to cross 60). Do not buy if the price doesn’t cross 640.
 HDFC Ltd. rose from 2300 to 2900 levels, a move of over 25%, in just a matter of 10 days and then went through a brief consolidation, which has already lasted 8 days. A move above 2750 should confirm that the consolidation is over and it can give a move of another Rs.450/- in a matter of two weeks. If you can see the three trendlines on the chart, you can notice that it looks like an ‘F’ or a Flag complete with the staff. Look to buy above 2750 with a stop loss of 2600 for a target near 3200.
 IDBI, after a sudden downfall, went into a phase of consolidation for over 3 months and finally broke through the trendline, only to see a pullback back to the trendline. It has support at the trendline at 98 and today’s doji suggests that the support may have been found. Look to buy above today’s high of 102 with a stop below 95 for a target of 130.
Please do subscribe to my posts, so that all posts are delivered free to your inbox and you don't miss any useful analysis of the markets in the future.
Happy Investing!!!
Wednesday, May 7, 2008
All Set to Go North
If you remember yesterday’s edition, I had mentioned that the Nifty may touch the 1 month long trendline and bounce back from there. That is exactly what happened today. The Nifty stayed within a narrow range throughout the day, but did go low enough to touch not only the trendline but also the support provided by the 23.6% Fibonacci retracement at 5102.25. We had also mentioned that Fibonacci retracements are sometimes pretty accurate. Talk about accuracy and we see that the Nifty made a low of 5101.50, accurate upto 1 point.
 Other signs of support being provided are that even though the Nifty came down about 50 points today, the RSI kept hovering around the same levels and did not break 40. Both the price touching the trendline and the RSI finding support at 40 has been marked by blue circles. While the Nifty still did close in the red today but a bounce back from 5101 to 5140 in the last hour is a pretty good indication that the correction may be over.
I am a firm believer in blue chips. Over the years, I have seen lots of ups and downs in the markets and it is always the blue chips which have the power to surpass their previous highs, no matter what they are. I know there are many buyers out there with purchases of L&T above 4500 and Reliance above 3300. They may be sitting on a loss today but with just a little patience I’m sure they will end up in a profit.
Mid caps and small caps have their advantages too. We can take advantage of the momentum and speculation in such stocks. The only problem comes when we are holding these stocks and the market crashes. Technical Analysis gives us clear targets and stop losses. And without fail one of these levels is touched before the other. While we are better at closing positions near the targets (though, greed stops us sometimes), we are horrible at booking losses. This is where the third biggest enemy of ours (after greed and panic), hope, comes into play. It stops us from booking losses because we have seen on a number of occasions when the prices bounce back after our stop loss is hit. But when following technical analysis, discipline is very important. It is only the disciplined trader who wins over the others. But I know 80-90% of traders are not disciplined. And they always get stuck with small caps and mid caps during market crashes. And which is why I try recommending only blue chips. It is only during times like today when there are no blue chips available, that I take the help of other stocks. But it has to warned that discipline is very important when taking such trades.
 Larsen and Toubro seems to have broken through its downward sloping trendline and seems to have completed a pullback to the trendline too. The doji day today (open and close at almost the same levels) suggests that the price may start going up tomorrow onwards. It seems to make sense because the RSI too has broken through its trendline and has gone through a pullback after the breakout so it has been moving in tandem with the price. It looks set for a target of around 3600 with a stop below 2890.
  Gokaldas Exports, a midcap stock, but a market leader in its industry of readymade apparels, also has made a bullish pattern on the charts. With the volumes not showing anything except the breakout volumes today, can’t say whether it is a true head and shoulders pattern or not but it definitely looks like one. With a stop loss below 204, one can buy it above 235 for a target between 290 and 300.
Please do subscribe to my posts, so that all posts are delivered free to your inbox and you don't miss any useful analysis of the markets in the future.
Happy Investing!!!
Subscribe to:
Posts (Atom)